A report has one job: to show your client, in black and white, that working with you pays off. Most reports fail at exactly that, even though they look like a lot of honest work went into them.
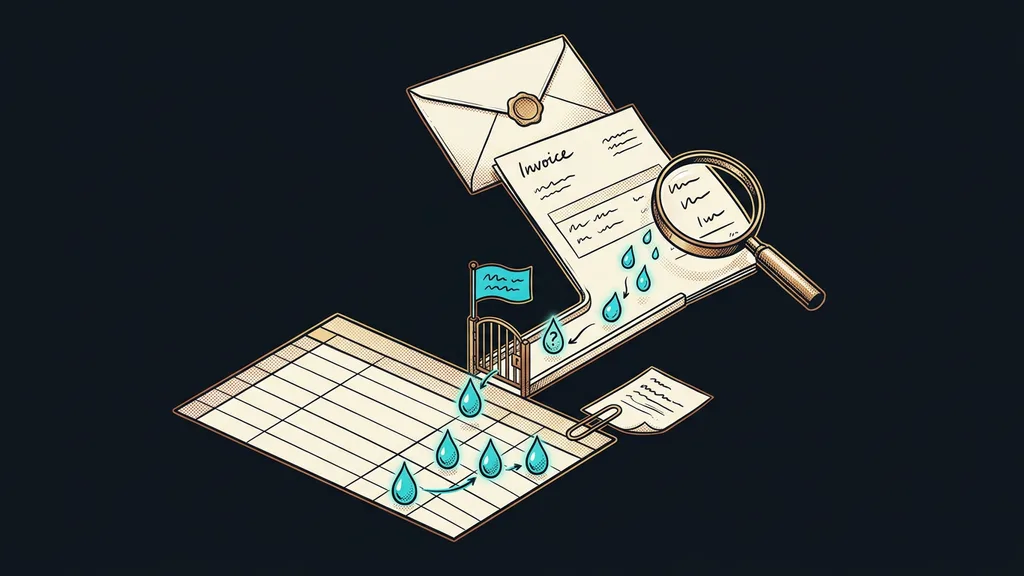
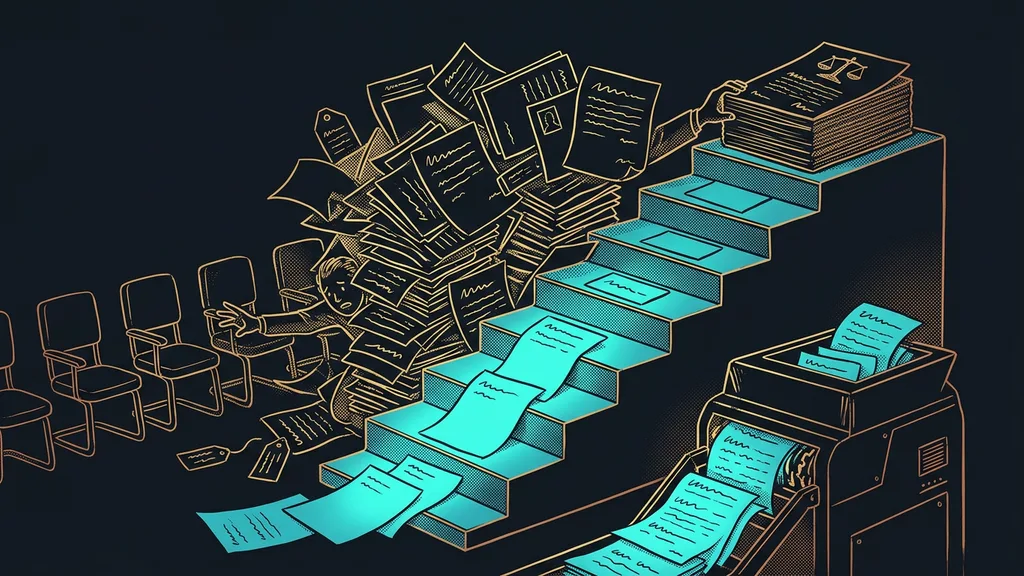
You know that evening at the end of the month. Four windows glow on your screen: the ad account, email stats, a spreadsheet of inquiries, invoicing. You copy a few numbers from each into a presentation, add some commentary, and around 10:30 p.m. the monthly report goes out to the client. In the morning, a one-line reply lands: “Thanks. So what has this actually earned us?”
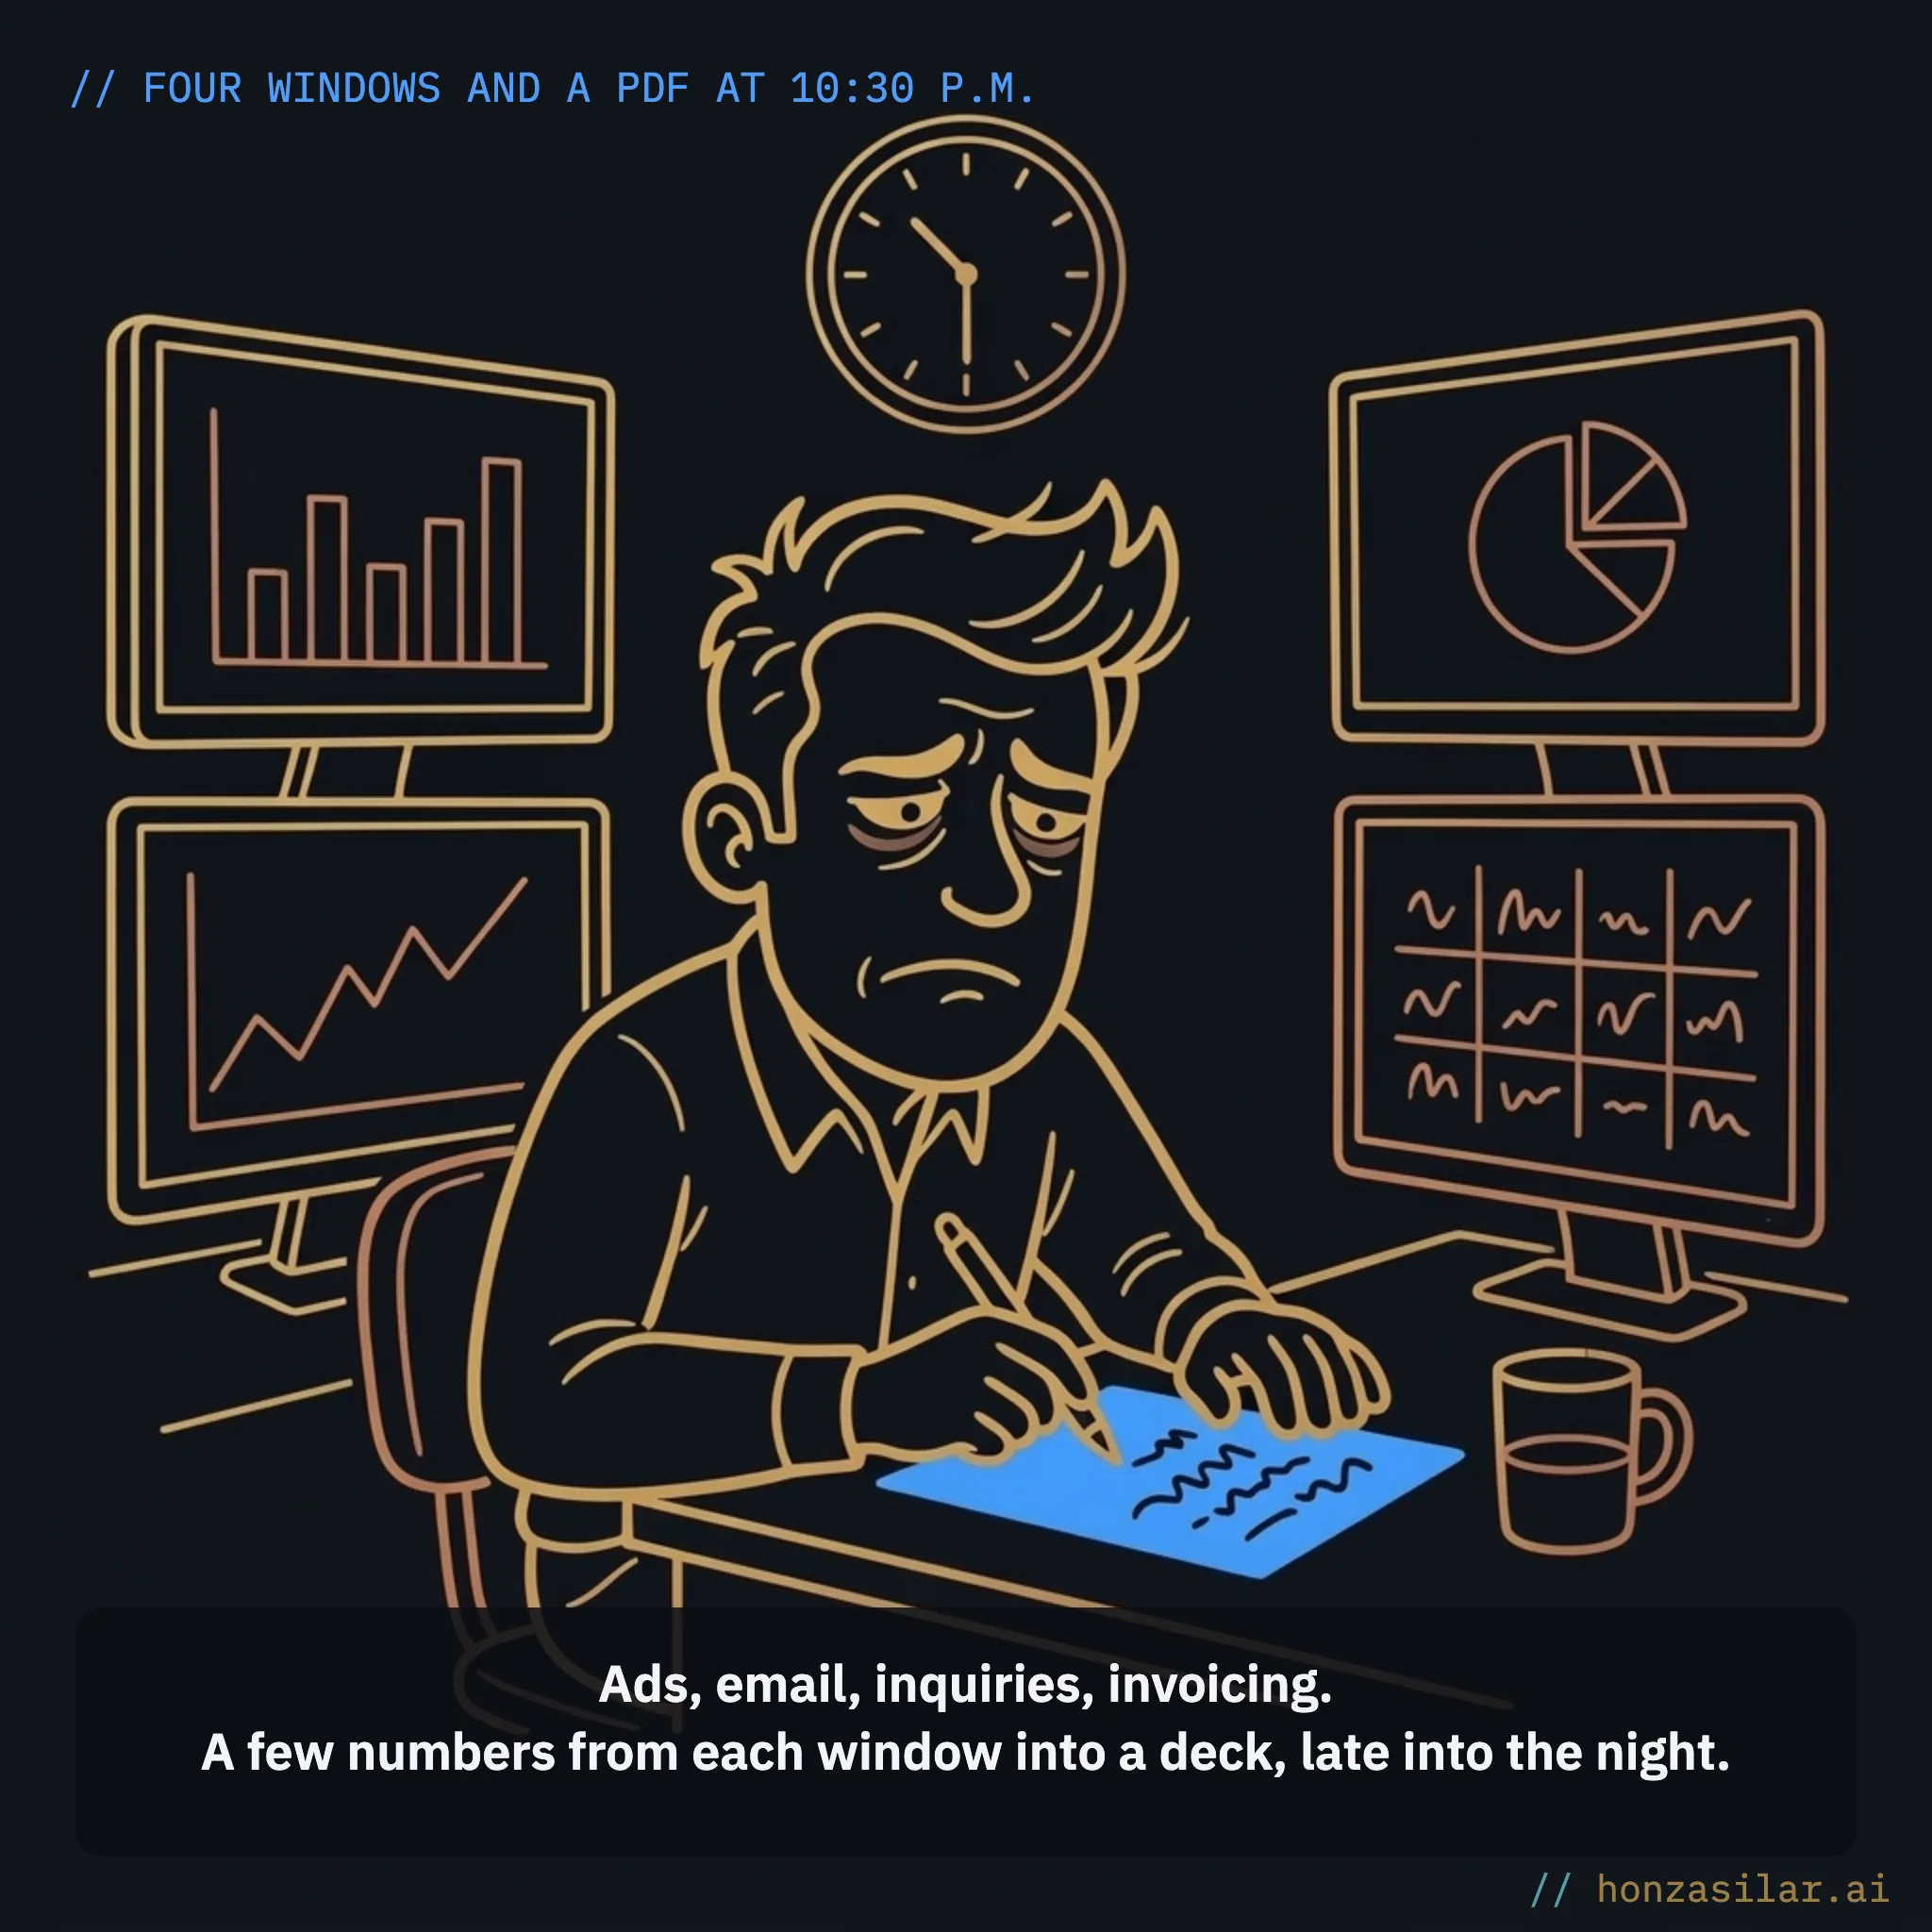
I set up GoHighLevel for clients every day, so I see this scene from both sides. Agencies do honest work and then, month after month, repackage it into a PDF that still doesn’t show the main thing. And business owners receive those PDFs, politely file them away, and quietly draw their own conclusions.
“We paid them for over a year. Something was probably happening, but we never once saw it in black and white.”
A business owner told me that about his former agency. The most important word in that sentence is “former.”
The invoice arrives like clockwork. The results don’t
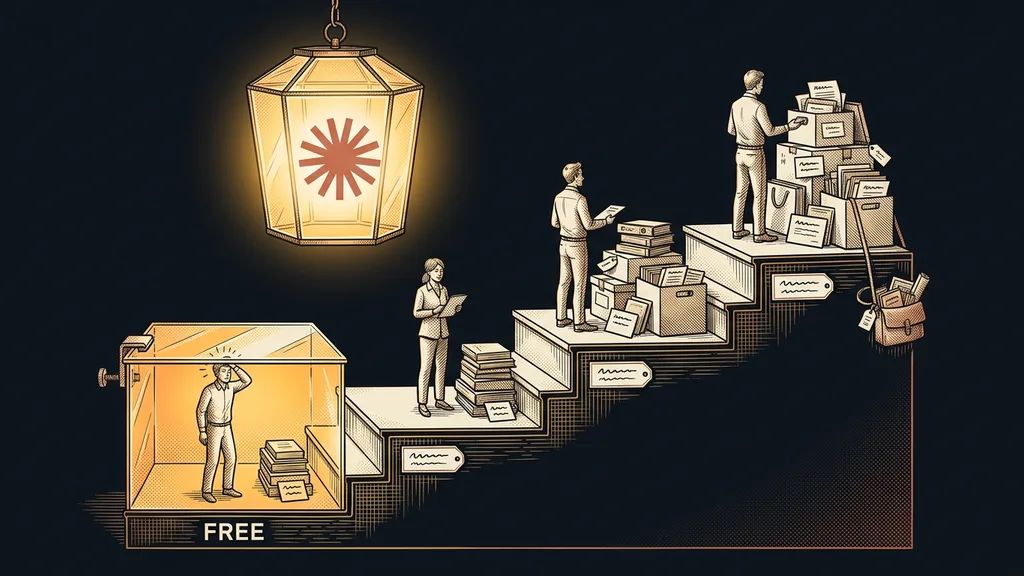
What clients pay for is inquiries and deals, not email opens, reach, or pretty charts. Meanwhile, the invoice arrives with iron regularity, and the results don’t keep pace. The results are there. Nobody has translated them into a language the client understands: how many leads came in, how many turned into deals, and how much money that came to in the end.
When that translation is missing, the value of working with you drops a little in the client’s mind every month. On the surface, nothing happens; inside, doubt slowly grows. When it’s time to cut the budget, the first line to go is the one where nobody can see what it earns. For an agency built on recurring revenue from long-term clients, that’s the most expensive cut a client can make.
Static monthly PDF vs. live dashboard
Static PDF
You build it in the evening from four tools.
The client gets it once a month.
Pretty charts don’t show what they earned.
Live dashboard
It builds itself from data you already have.
The client looks anytime, not just once.
They see lead sources, conversions, and revenue in koruna.
When data lives in one system, the report builds itself
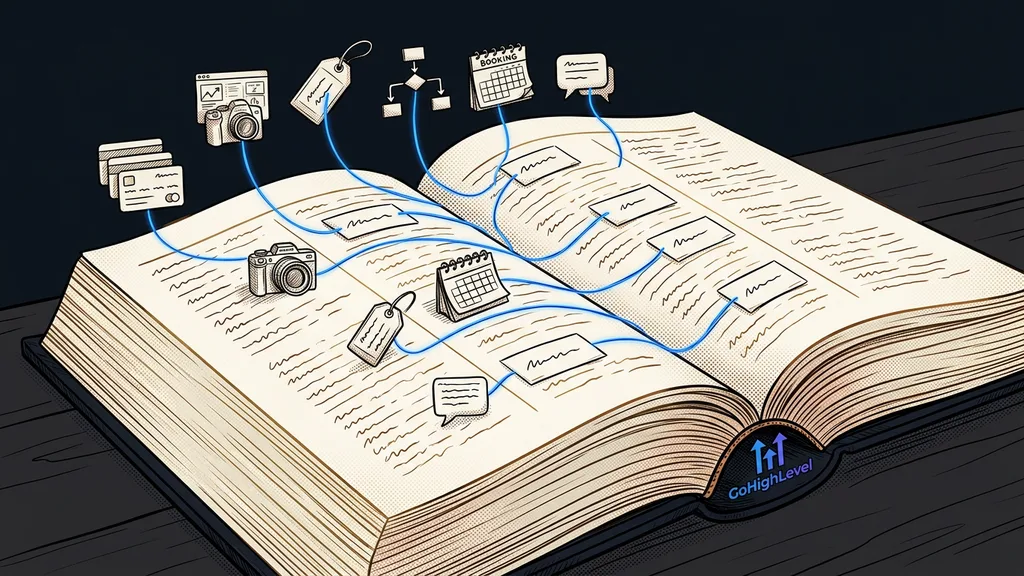
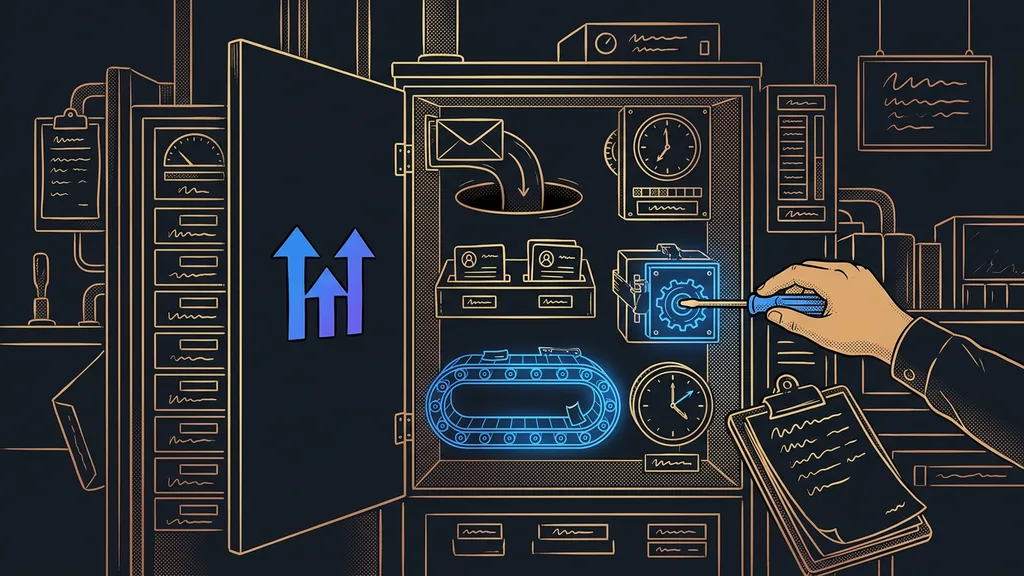
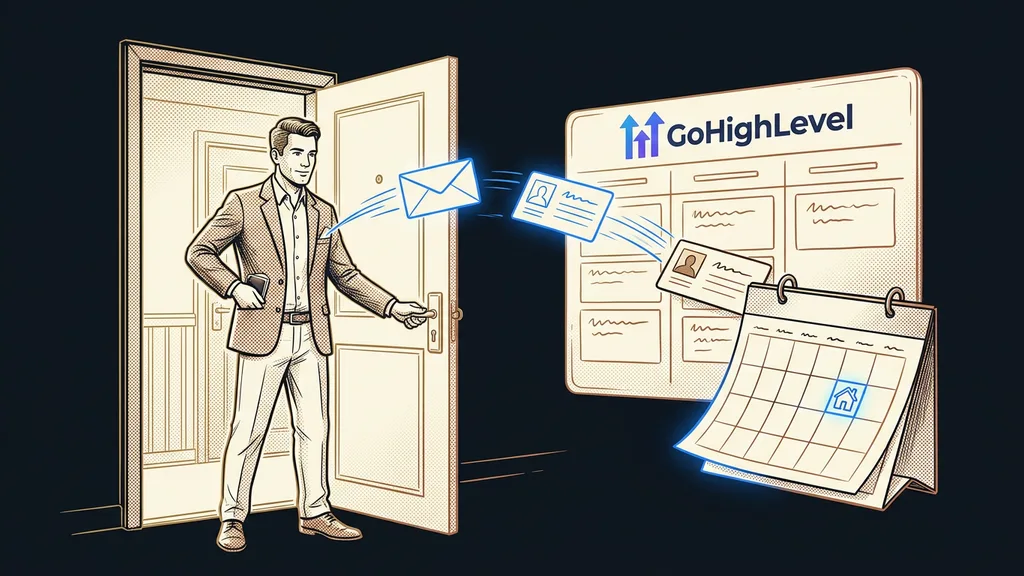
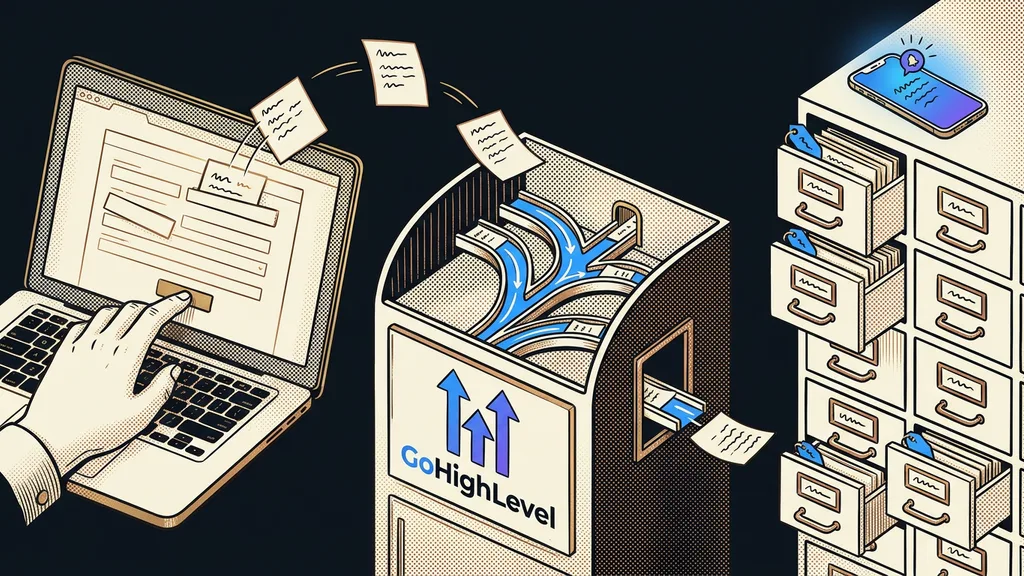
GoHighLevel keeps forms, emails, calendars, ads, deals, and payments under one roof. A lead from a form drops straight into the pipeline as a new opportunity, and everything else gets added to the same contact: every email, text, and call on one timeline, a booked appointment, a paid order.
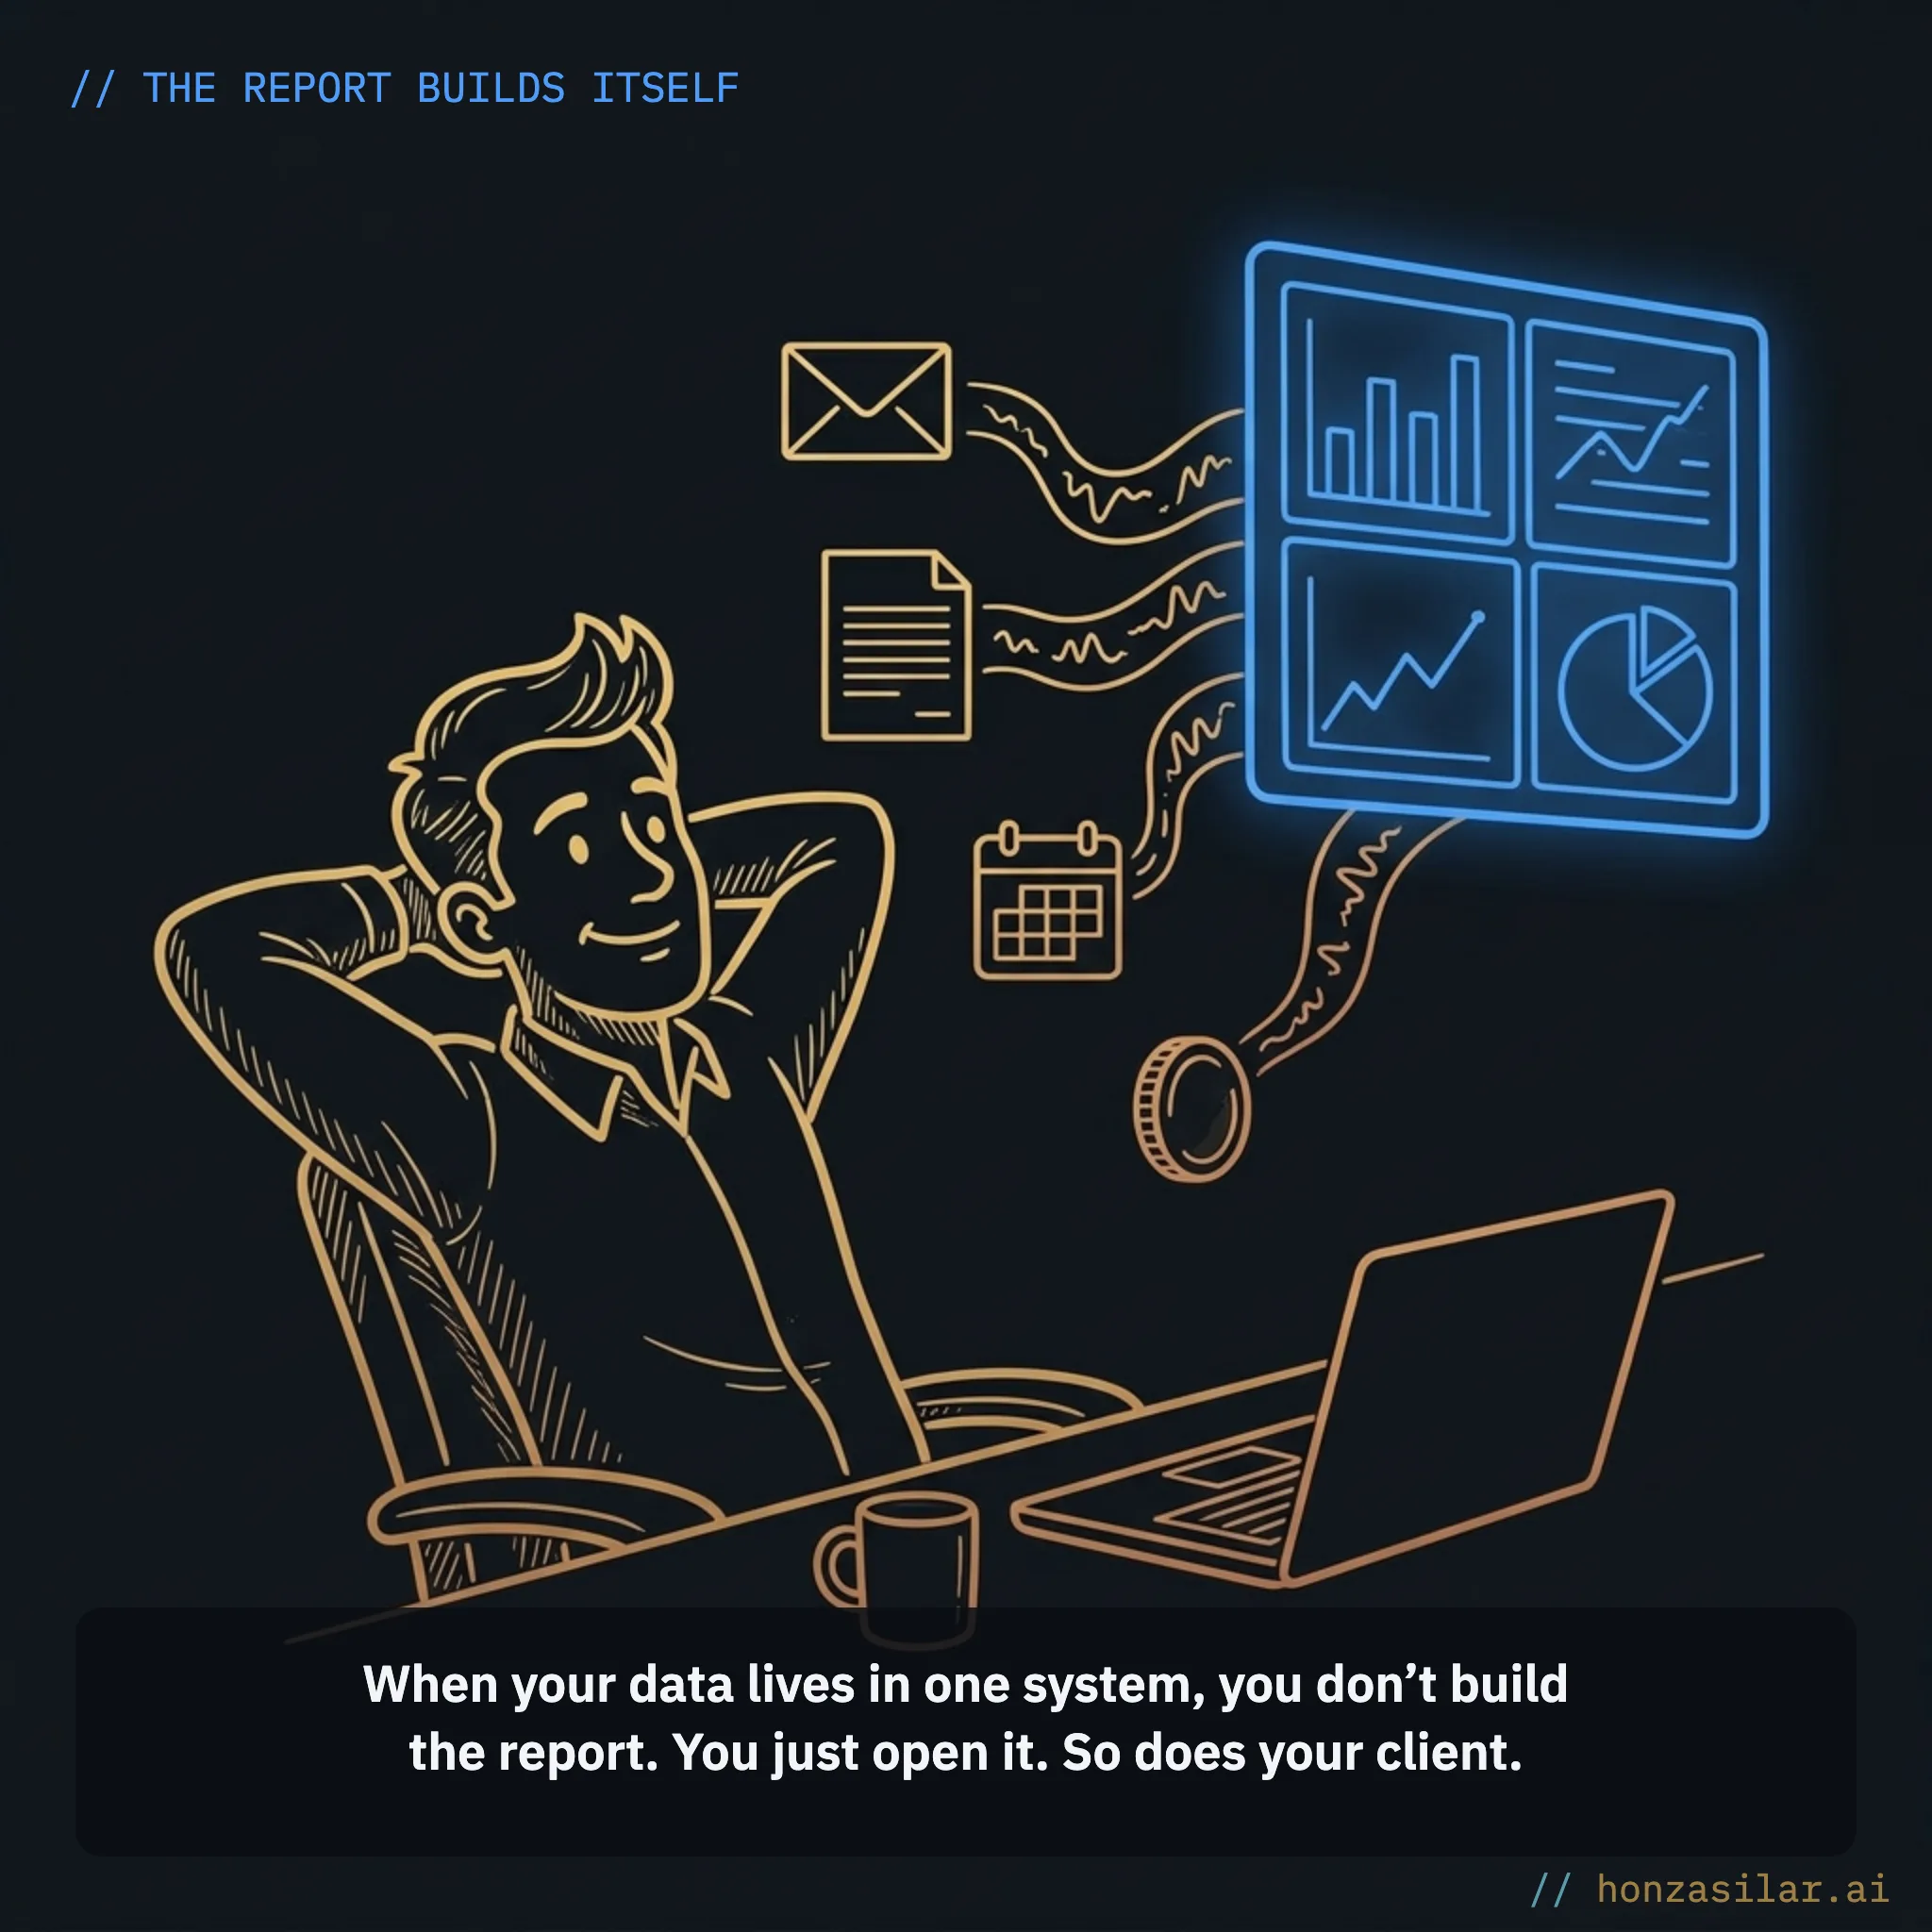
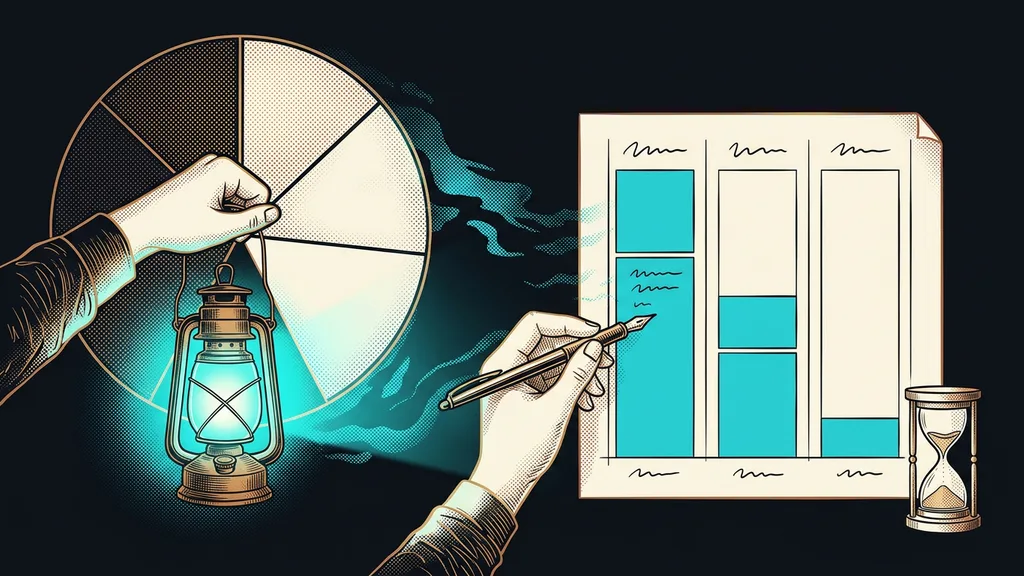
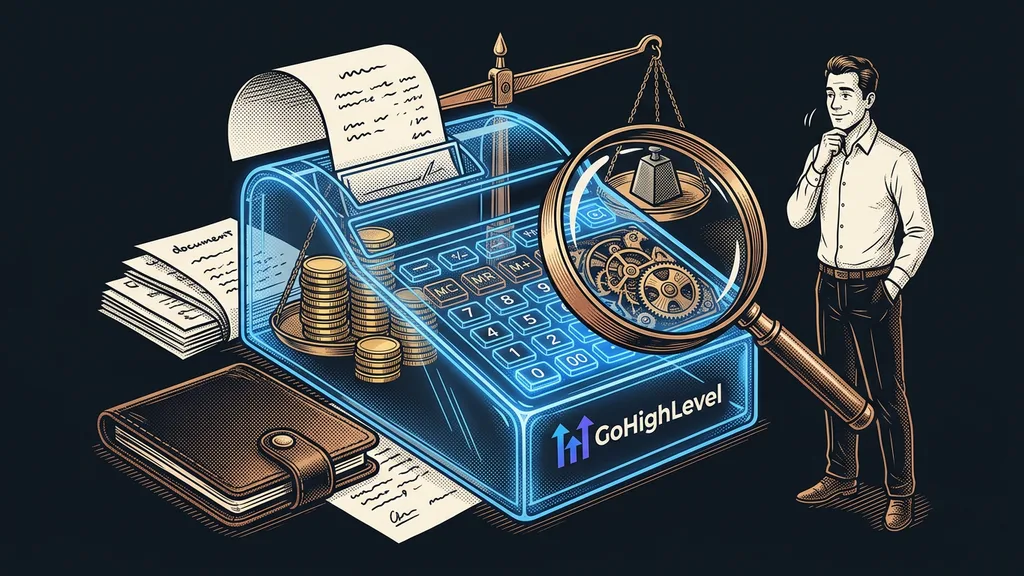
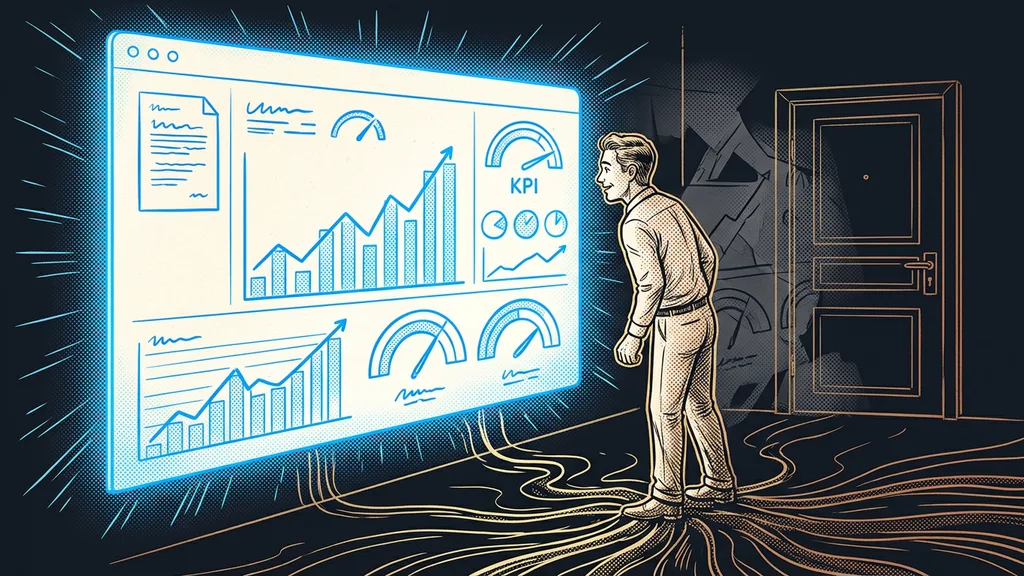
Reporting is then just a view of data that already exists. You put the dashboard together from widgets tailored to the client, and from then on, it updates itself. You don’t produce a report at the end of the month, you just open it. And your client can look anytime, not just once a month when you send it.
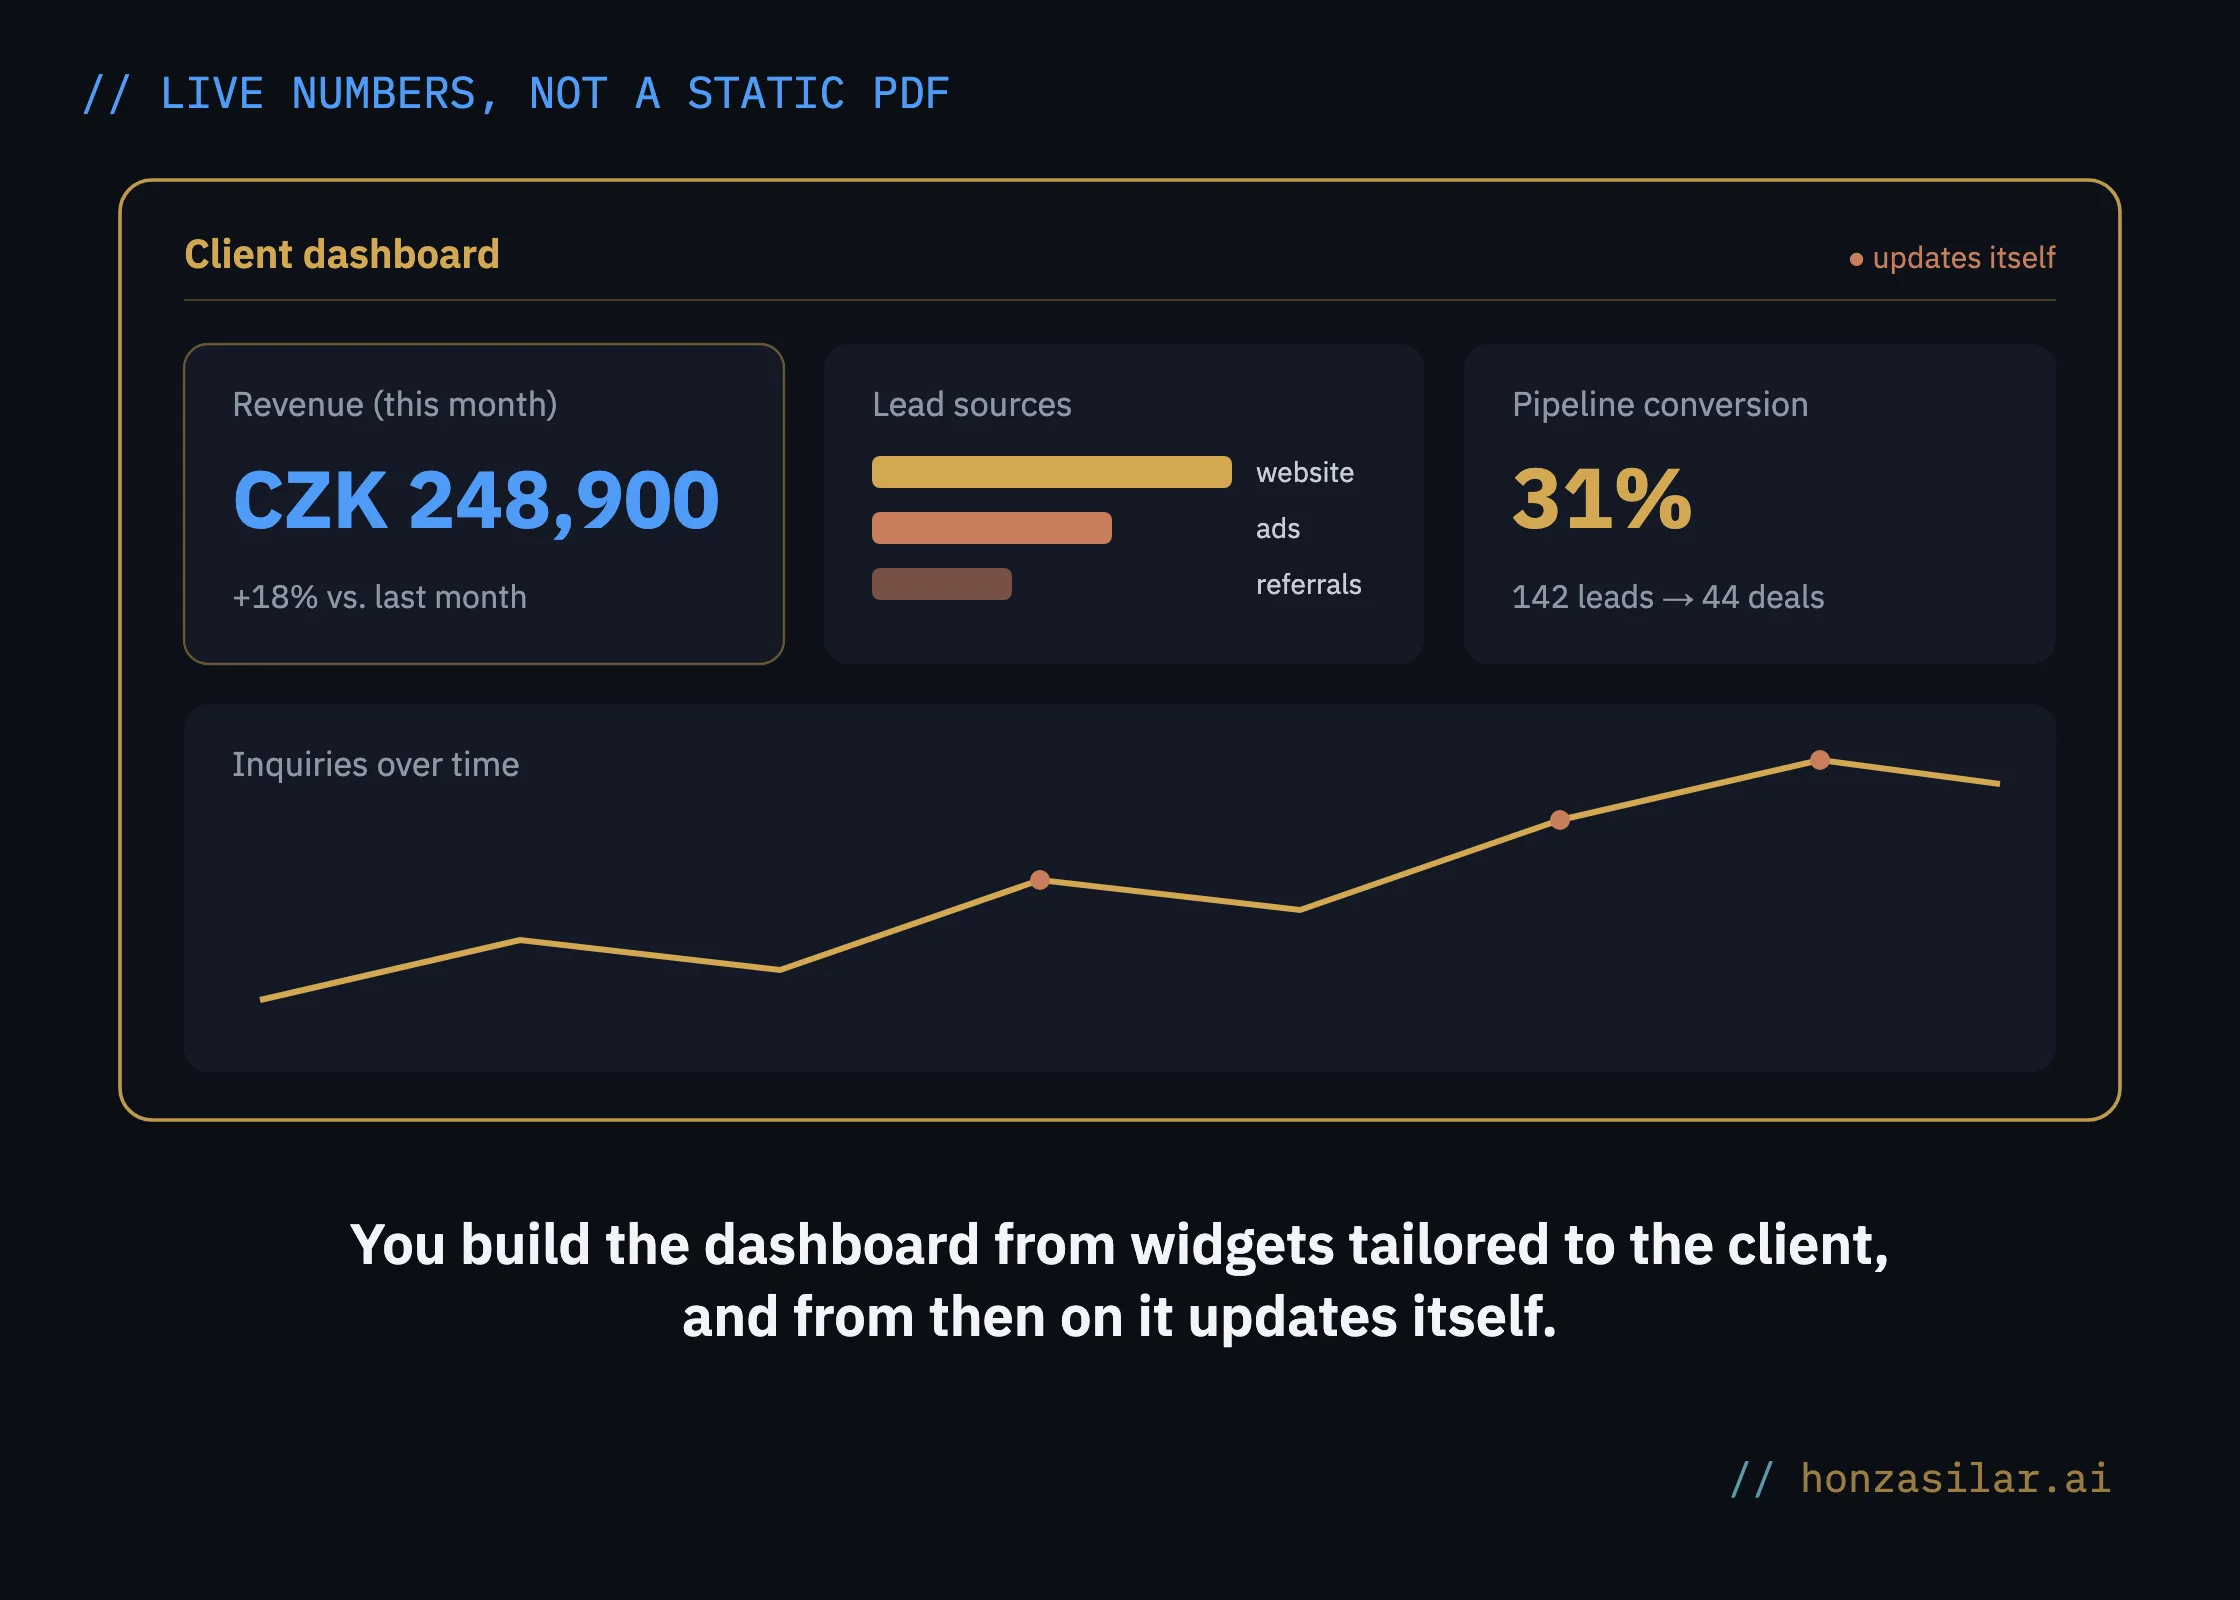
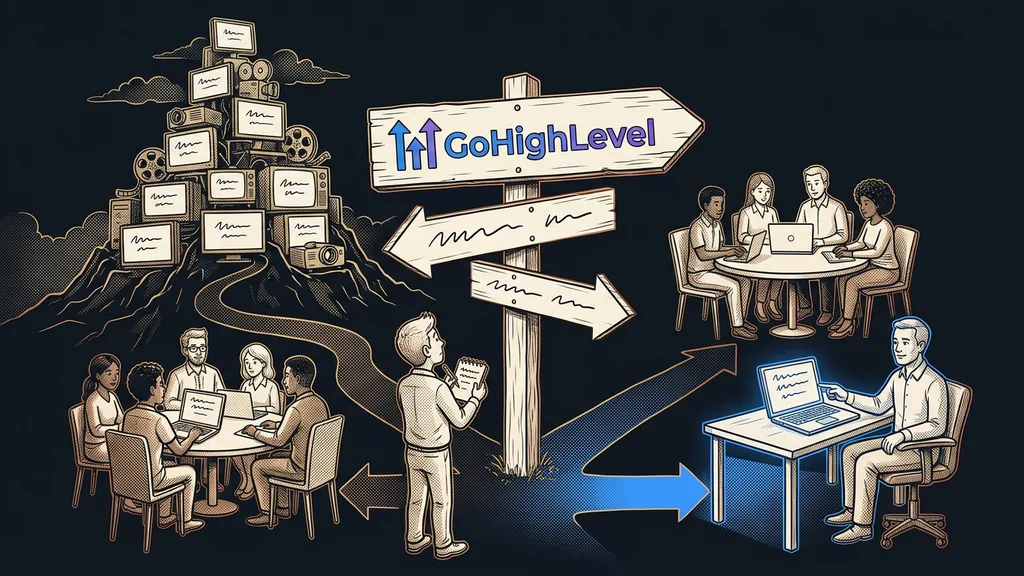
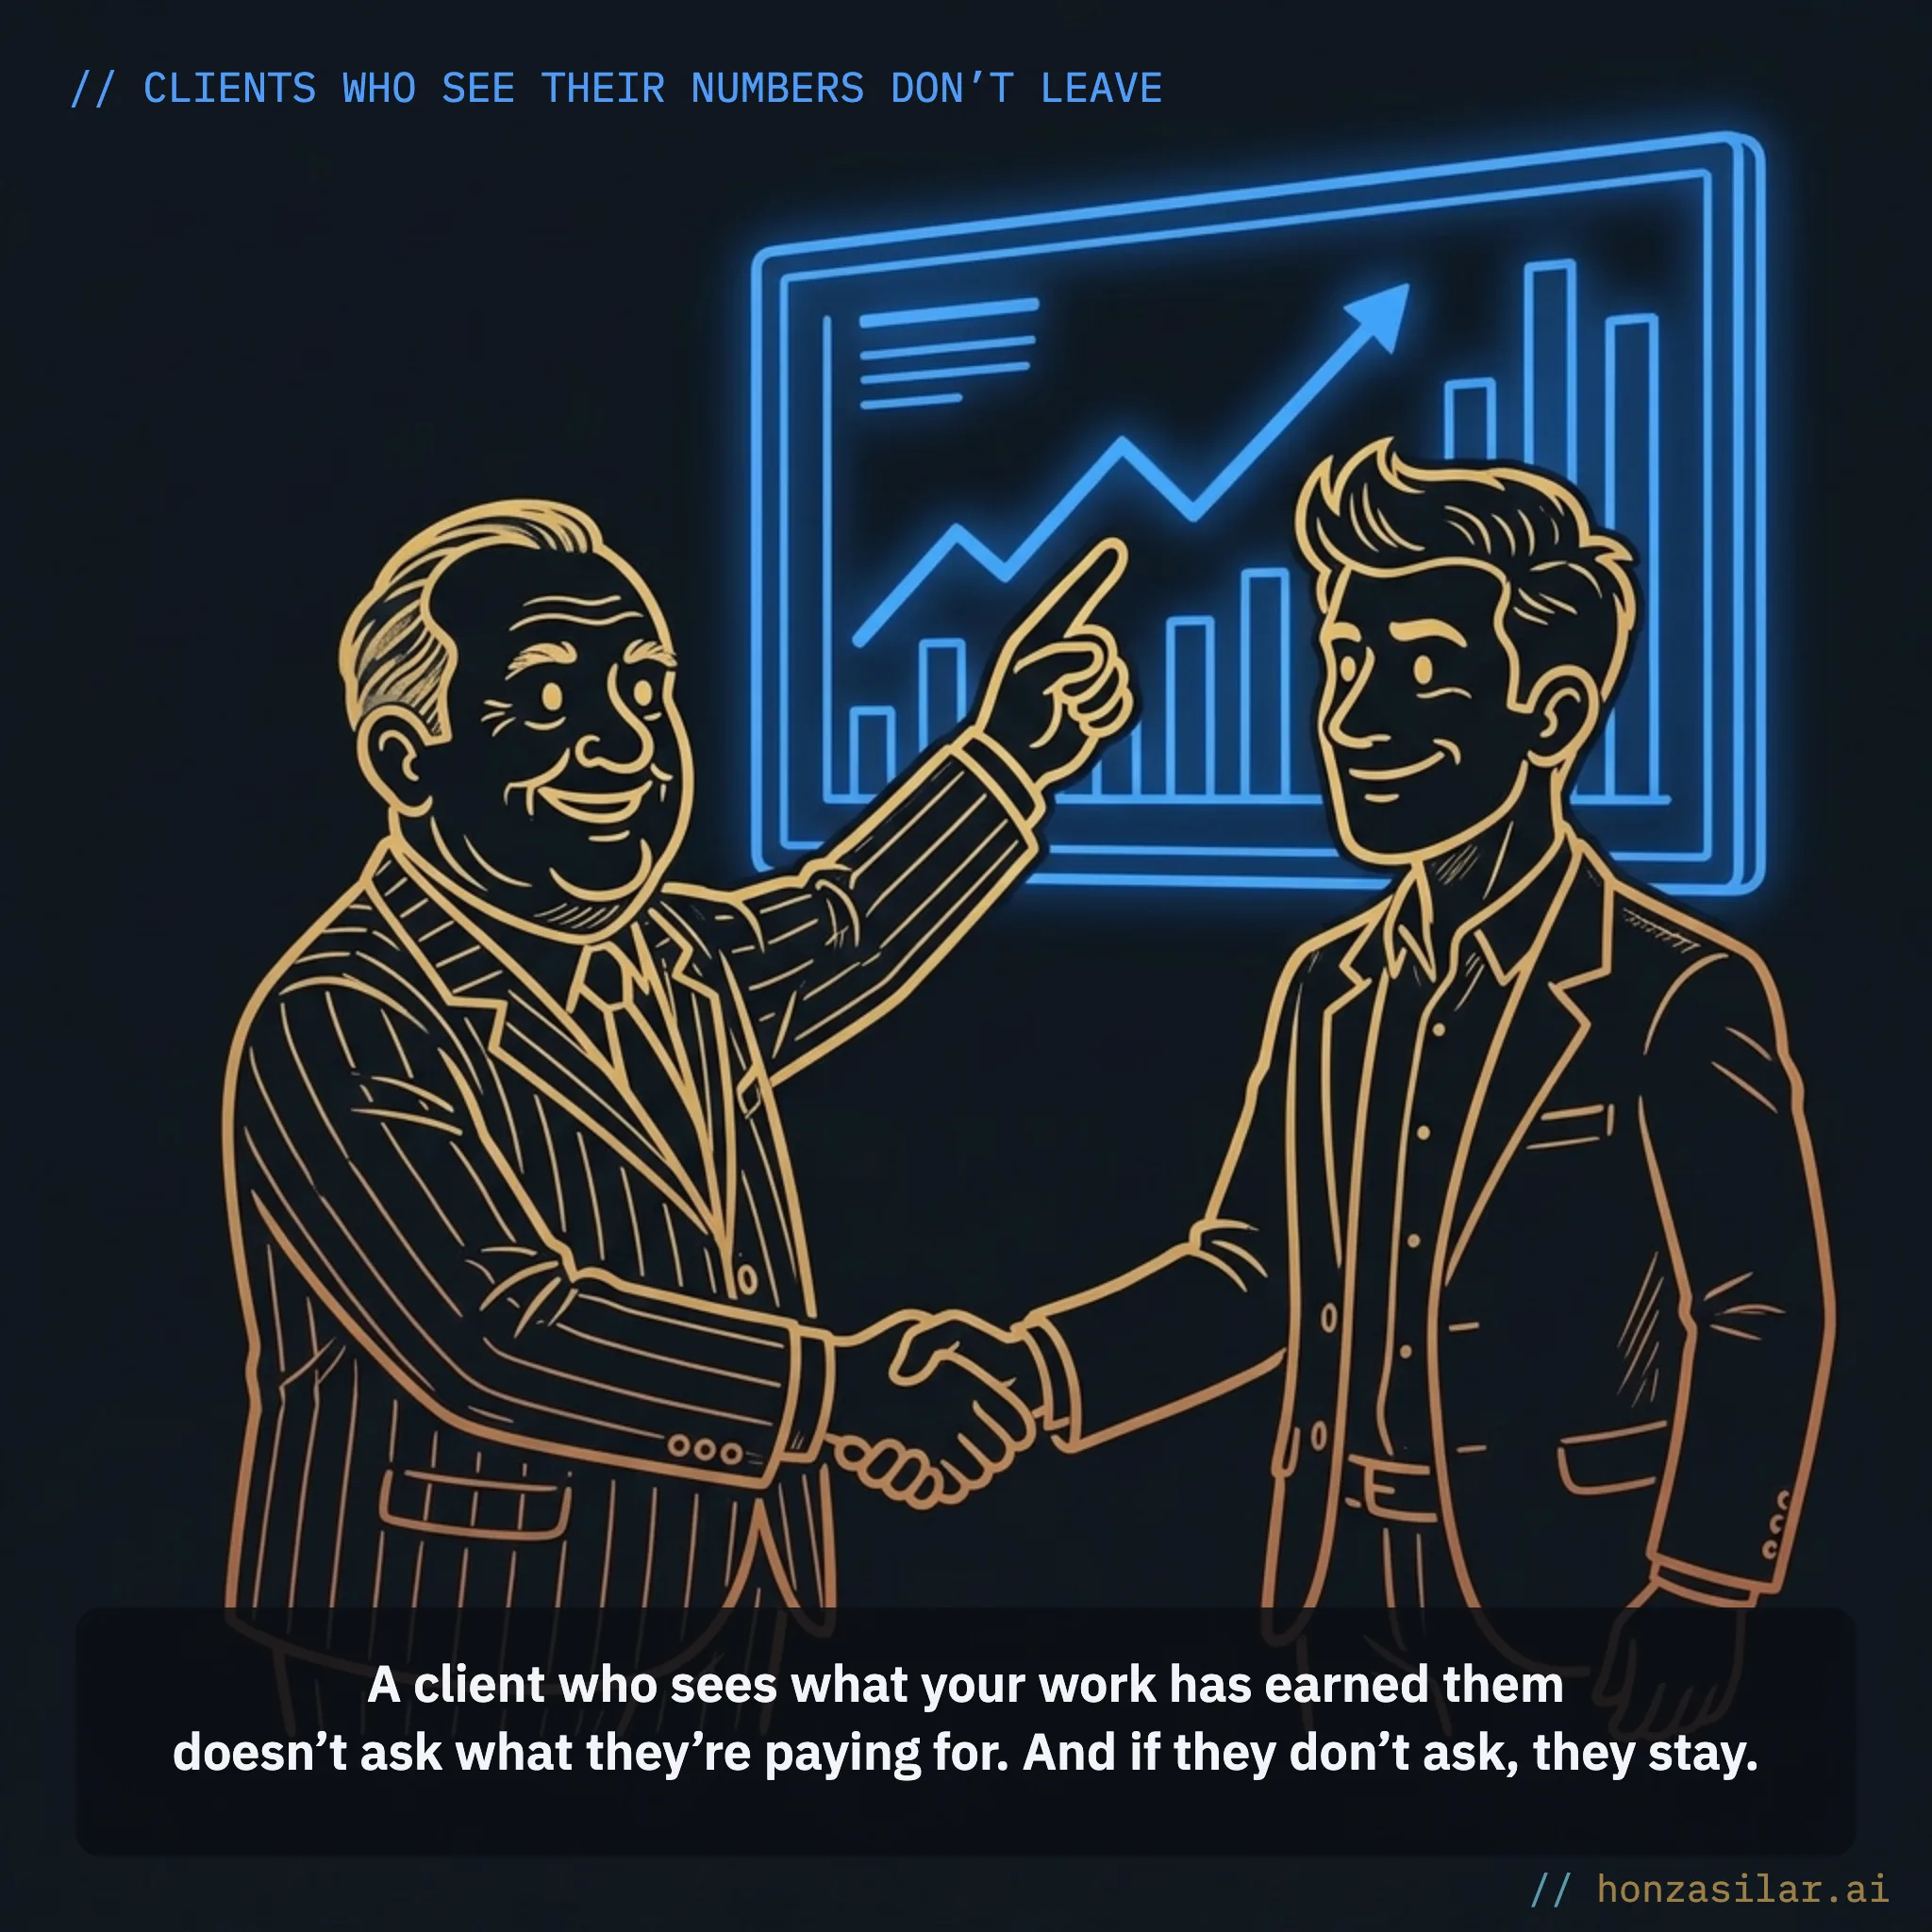
That changes the nature of the whole relationship. Instead of defending your work over a static PDF, you sit with your client over live numbers and talk about what’s next. The difference between “trust me” and “see for yourself” decides whether you’re an expense to your client or a partner.
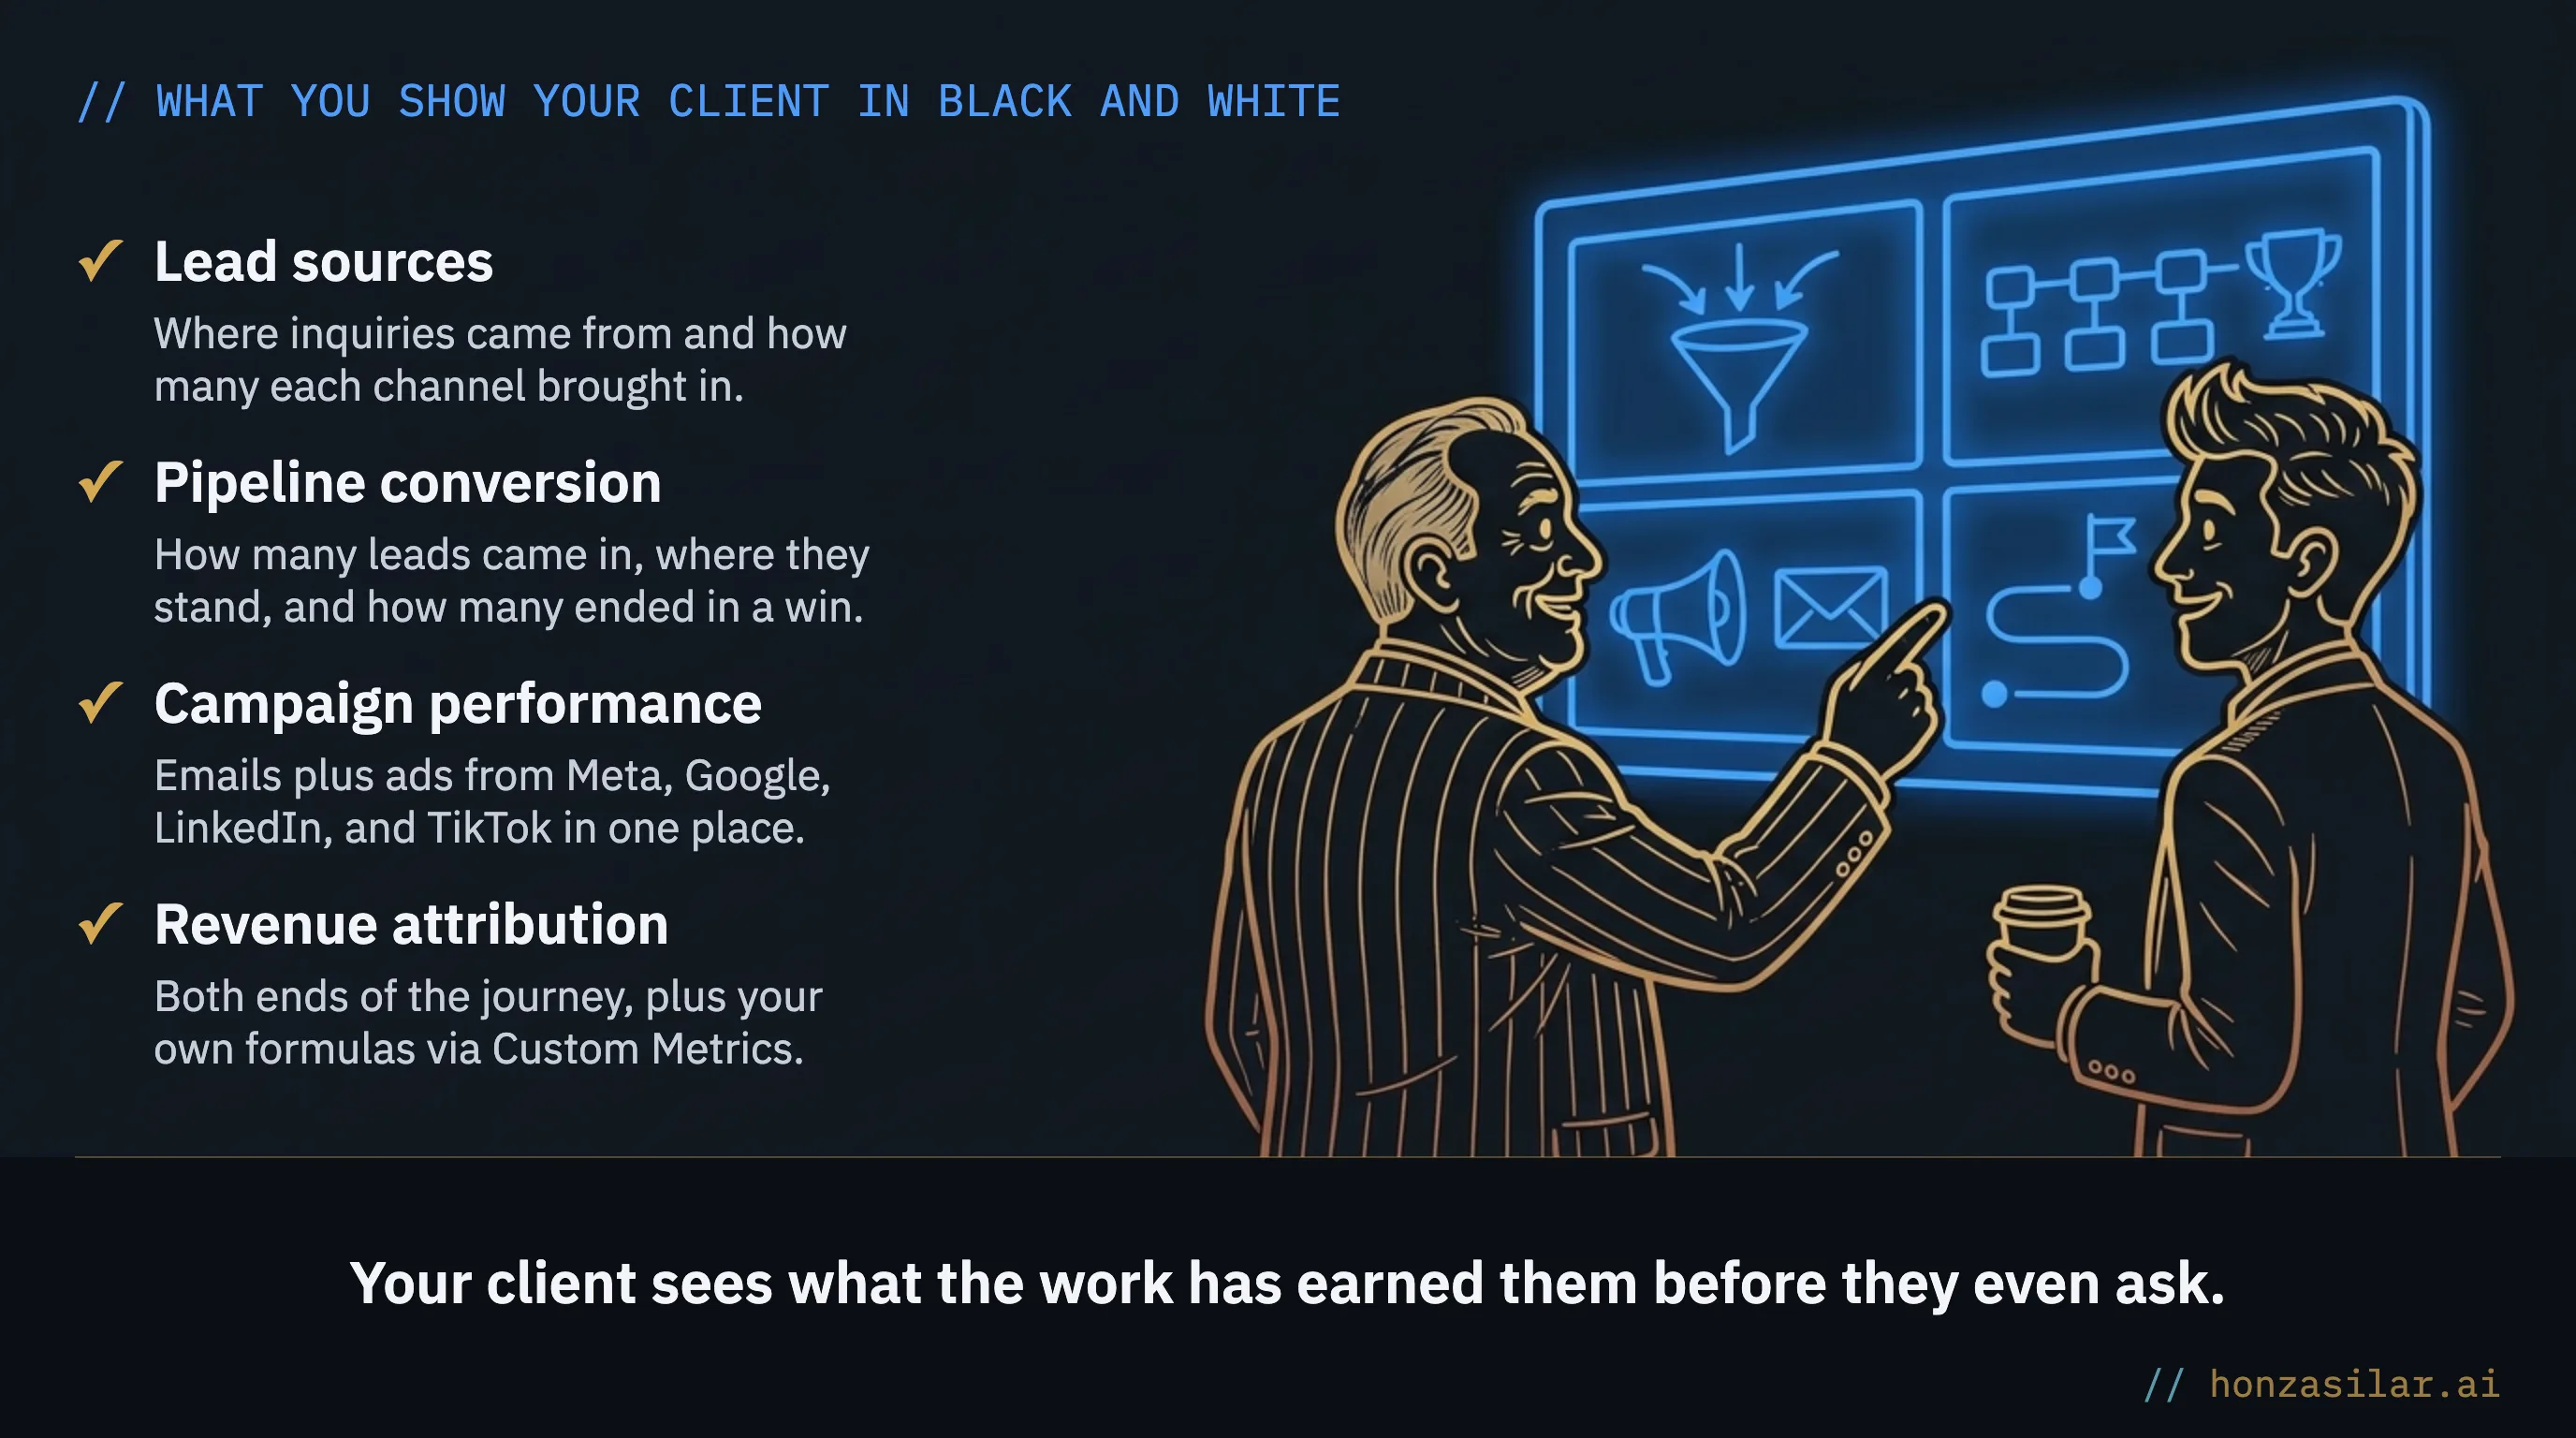
What you can show your client in black and white
- Lead sources. The dashboard shows where inquiries came from and how many each channel brought in over a given period. You stop arguing about whether the ads or the website form are doing more of the work.
- Pipeline conversion. You see how many leads came in, which stage of the deal each one is at right now, and how many ended in a win. The Lost Opportunities By Reason report tallies up why deals fall through and can export the reasons to CSV, and Stale Opportunities flags deals that have stopped moving.
- Campaign performance. Email campaigns run in the same system, so their numbers don’t have to be moved anywhere. You can test up to six subject line variants, and the system sends the winning version to the rest of your database on its own. Ads on Meta, Google, LinkedIn, and TikTok are managed through the built-in Ad Manager.
- Revenue attribution. For each deal, you see both ends of the journey. And with Custom Metrics, you can build your own formulas, such as average deal value, formatted as currency, a percentage, or a number.
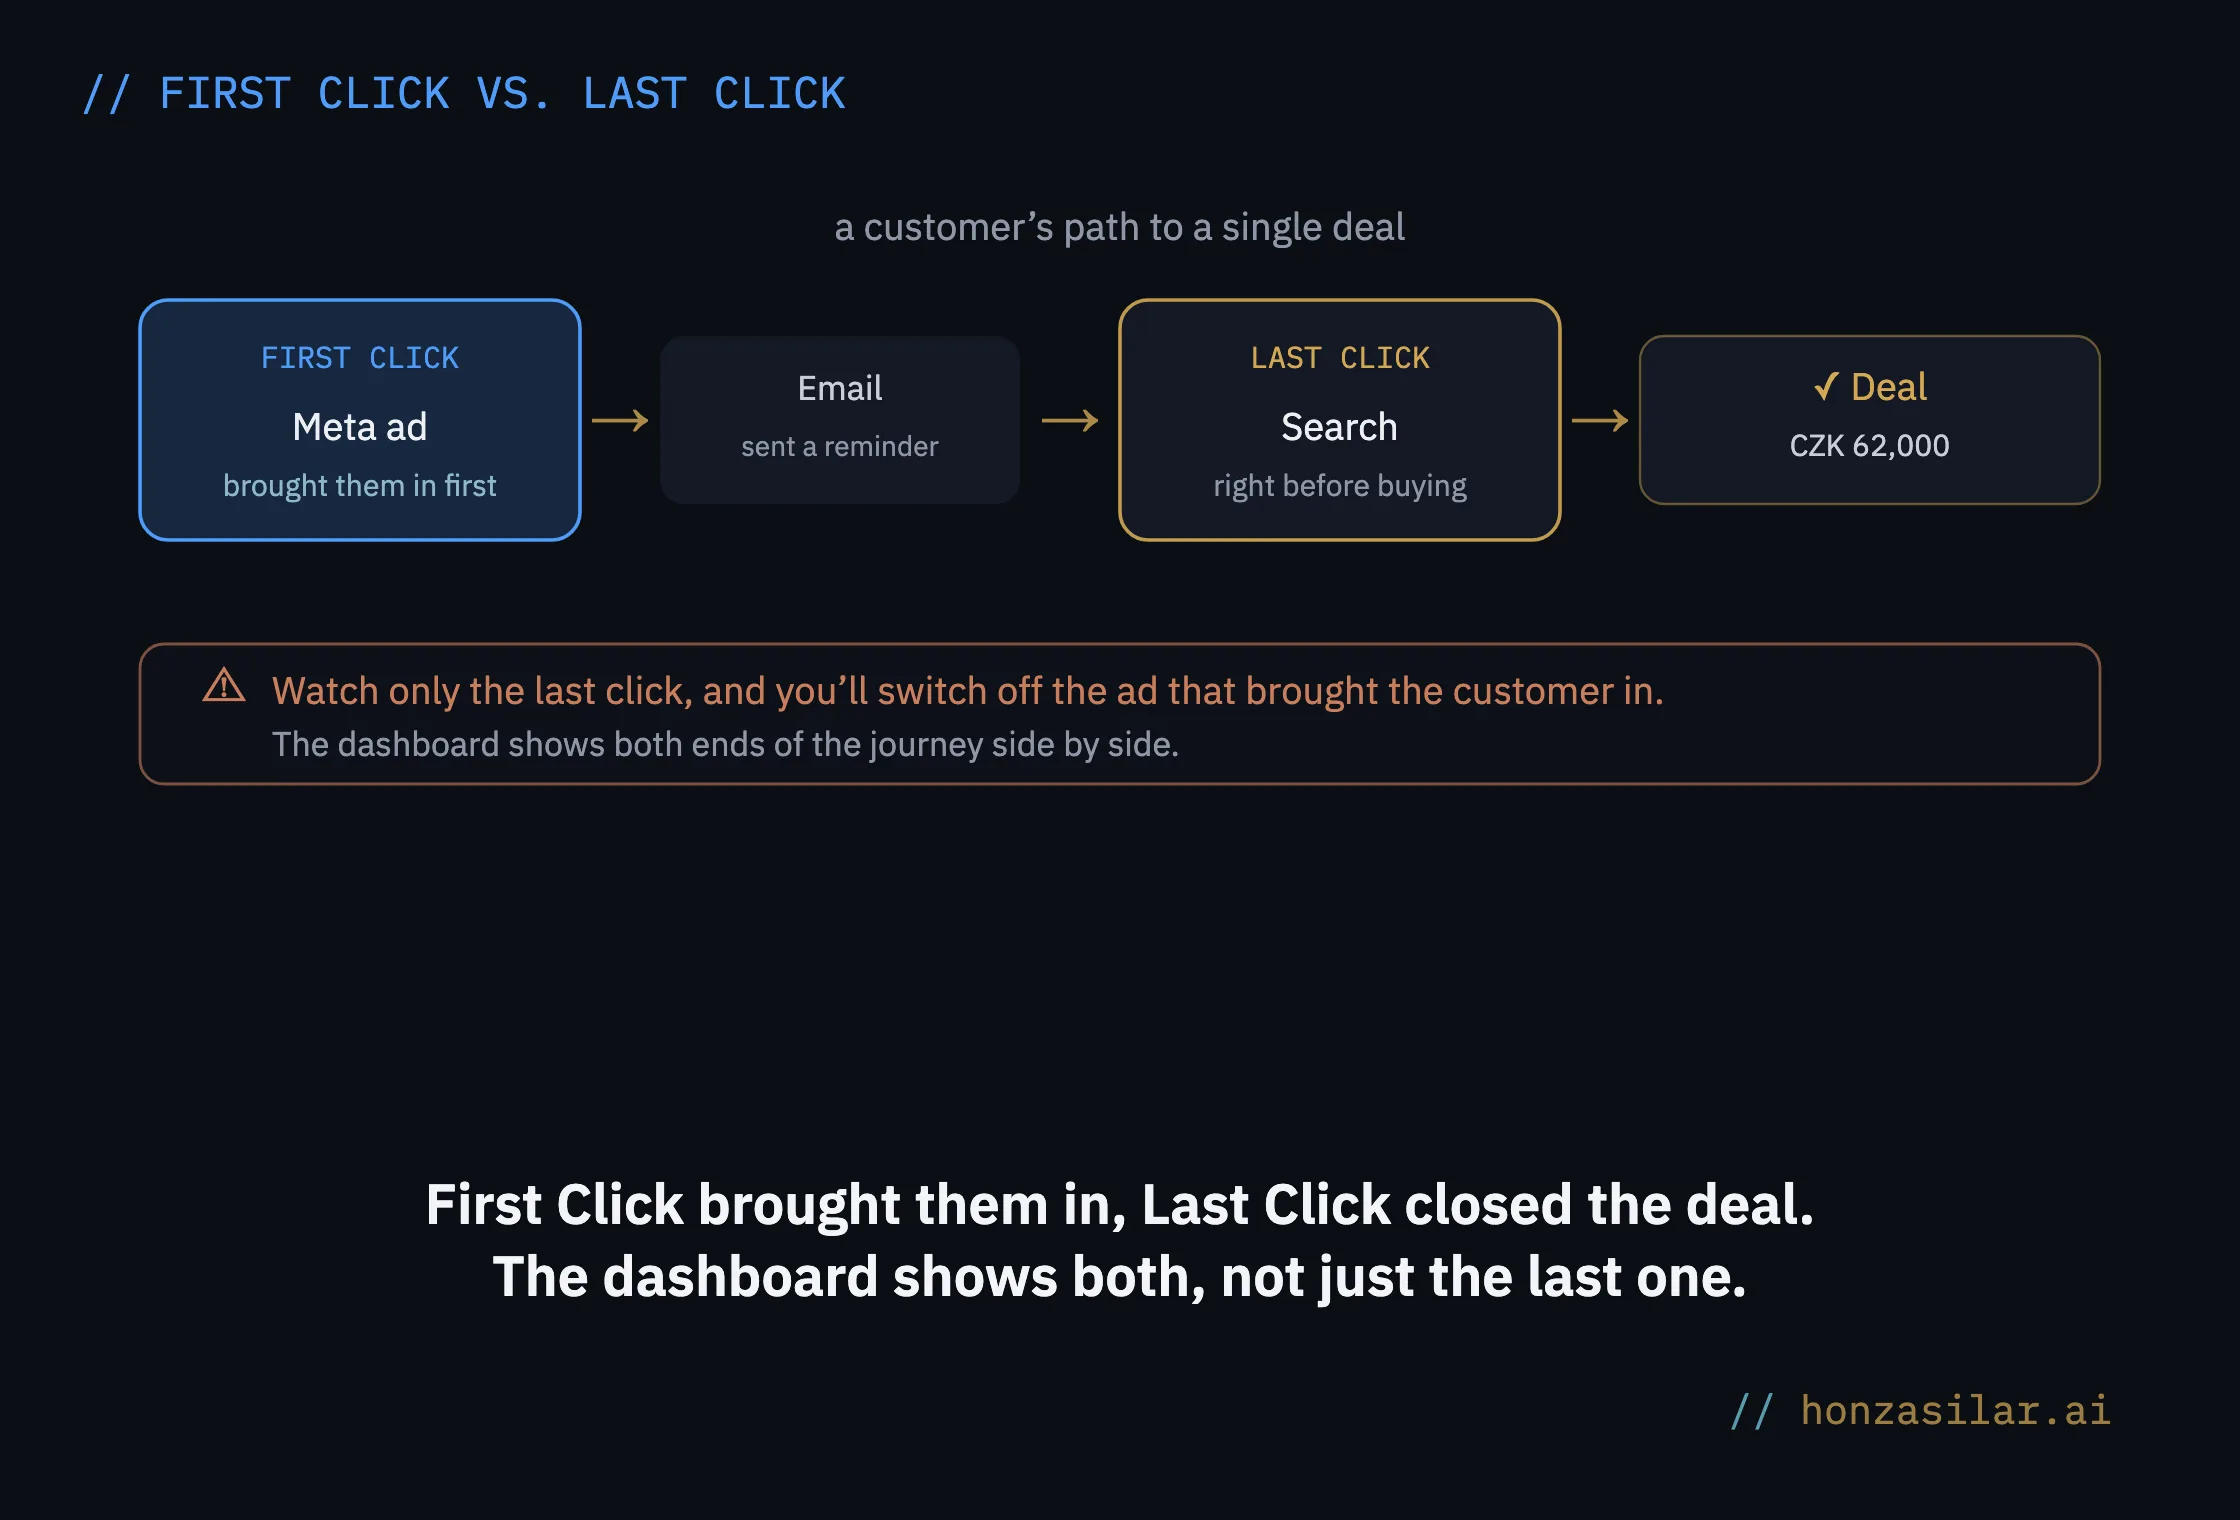
Attribution: First Click and Last Click
Two views of which channel gets credit for a customer. First Click shows the channel that brought them in the very first time, Last Click the one that convinced them right before the purchase. Watching only the last click is a trap that plenty of reports fall into.
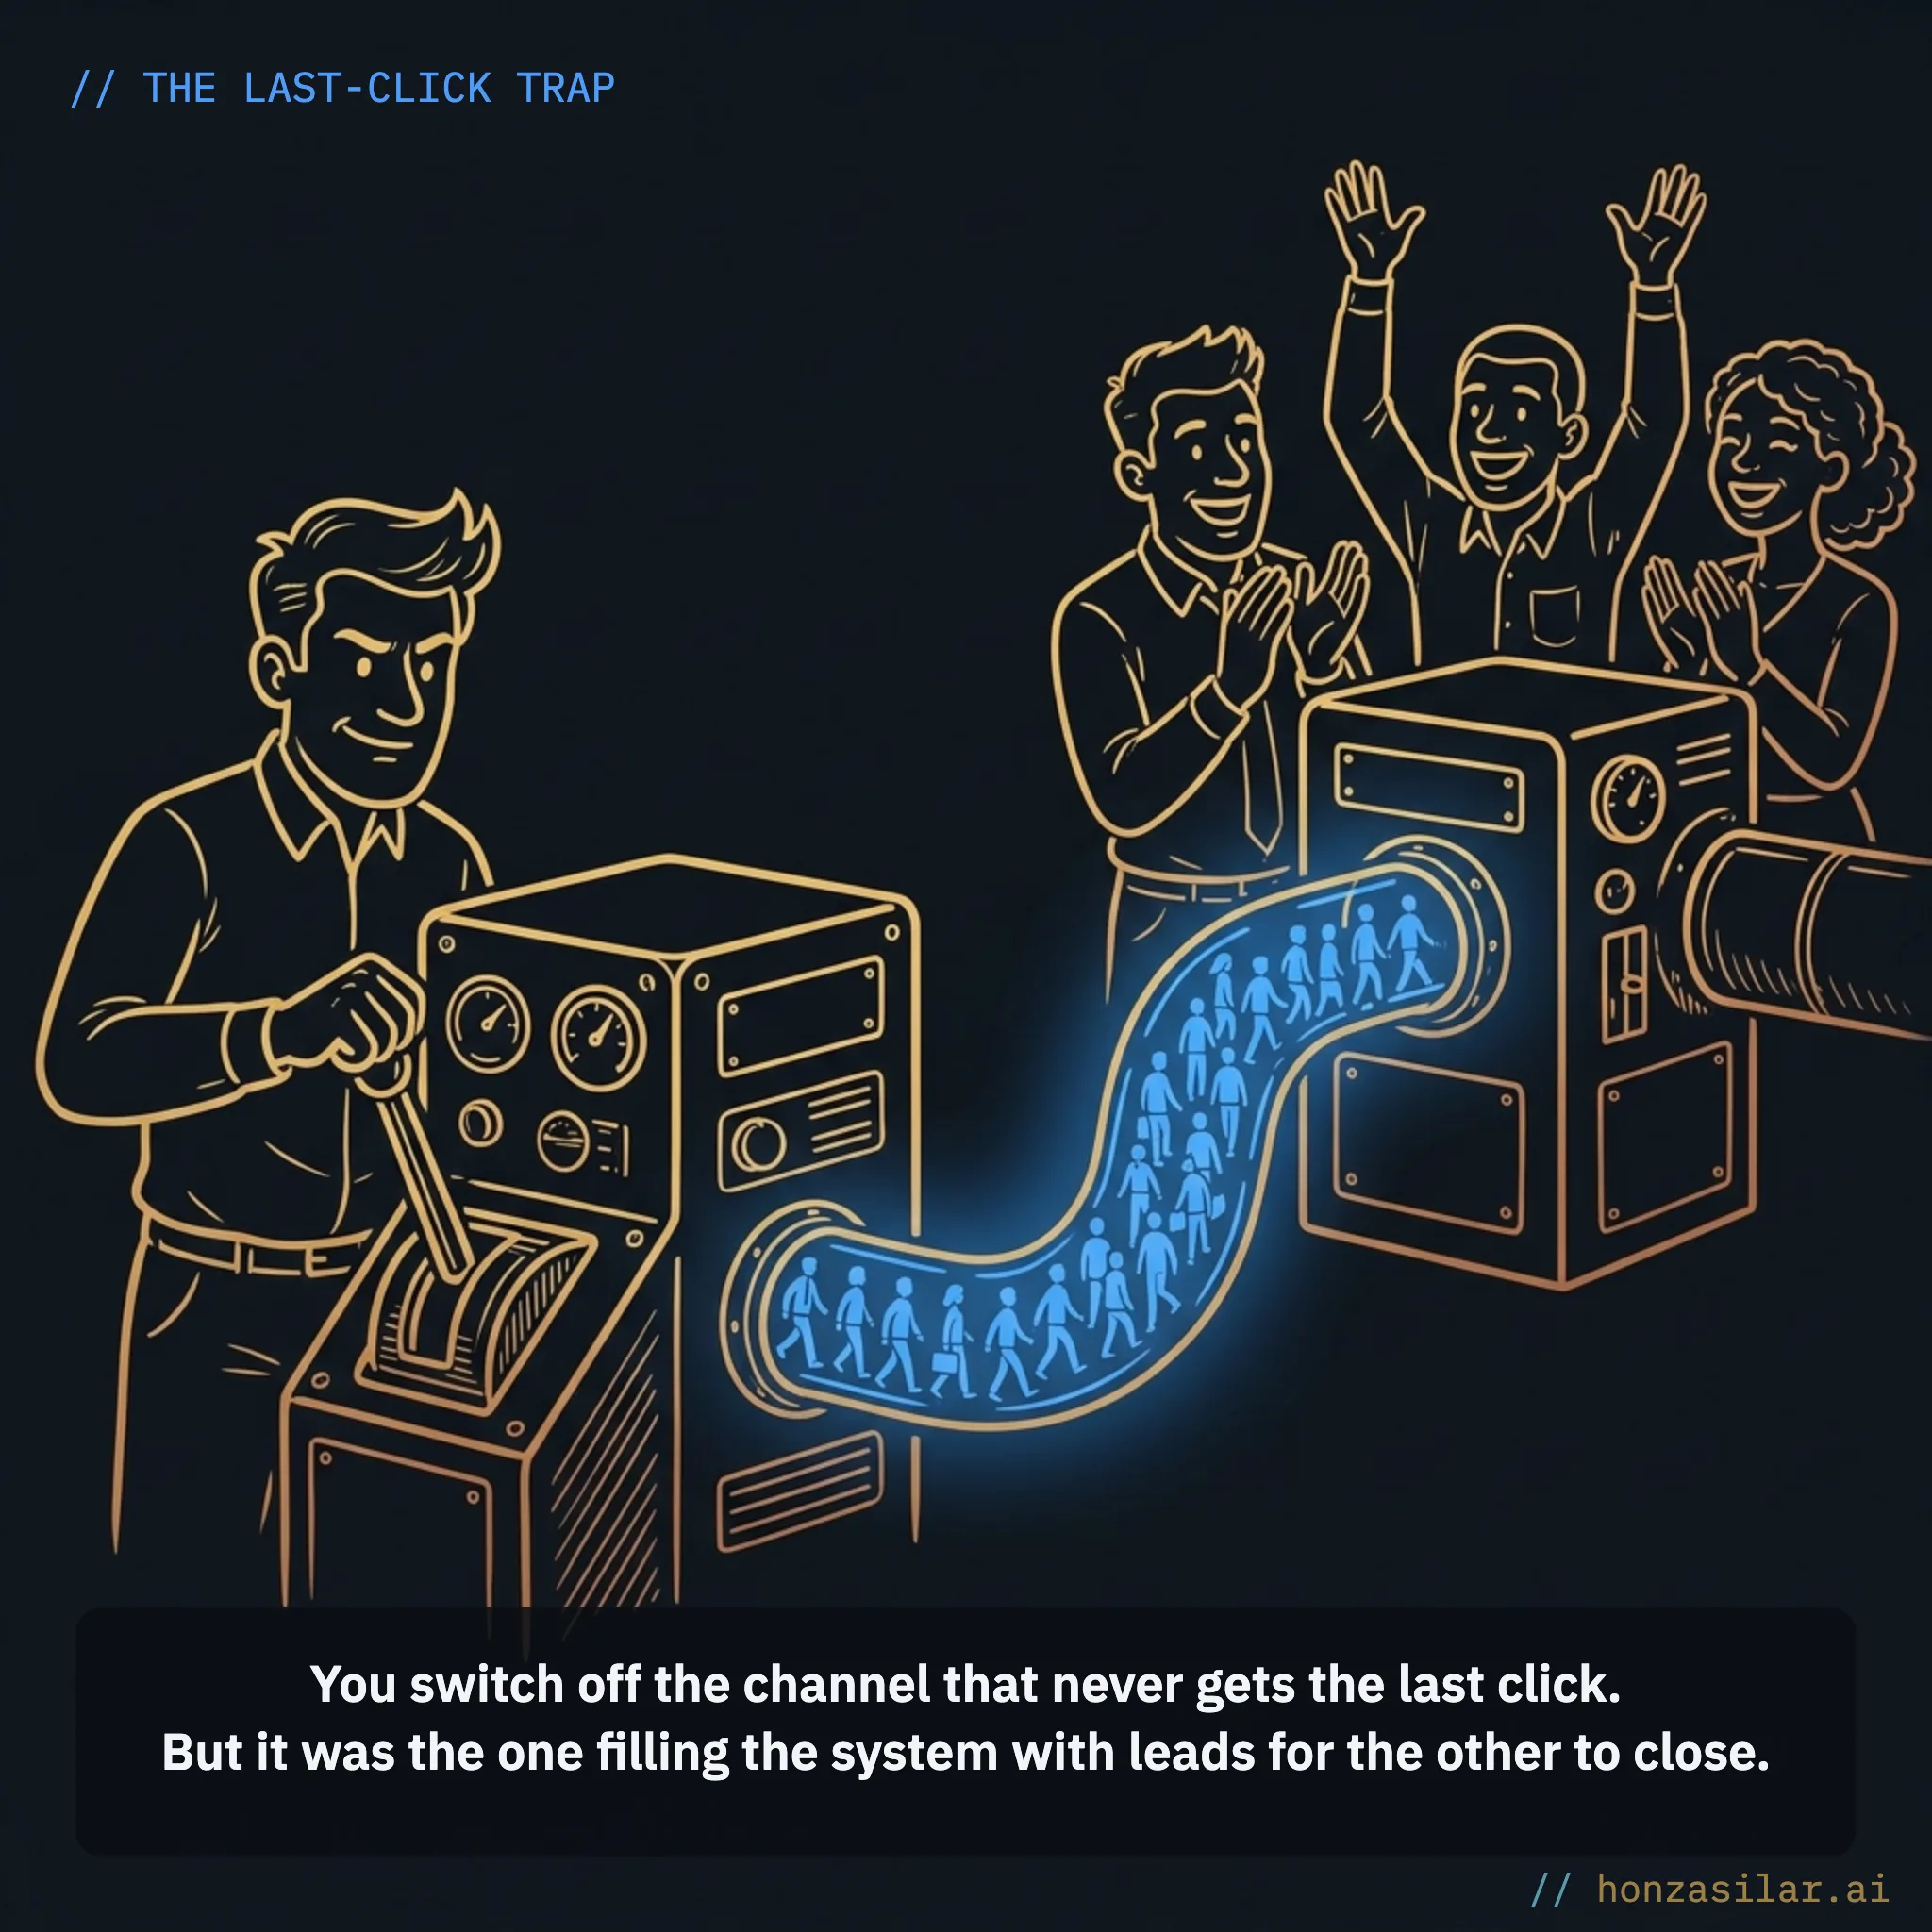
In practice
The most common slip I see in reports: channels get judged only by the last click, and the “non-selling” one gets switched off. But that’s often exactly the channel filling the system with leads that another channel then simply closes. Only a dashboard with both views side by side shows who’s really feeding whom.
Details agencies ask about
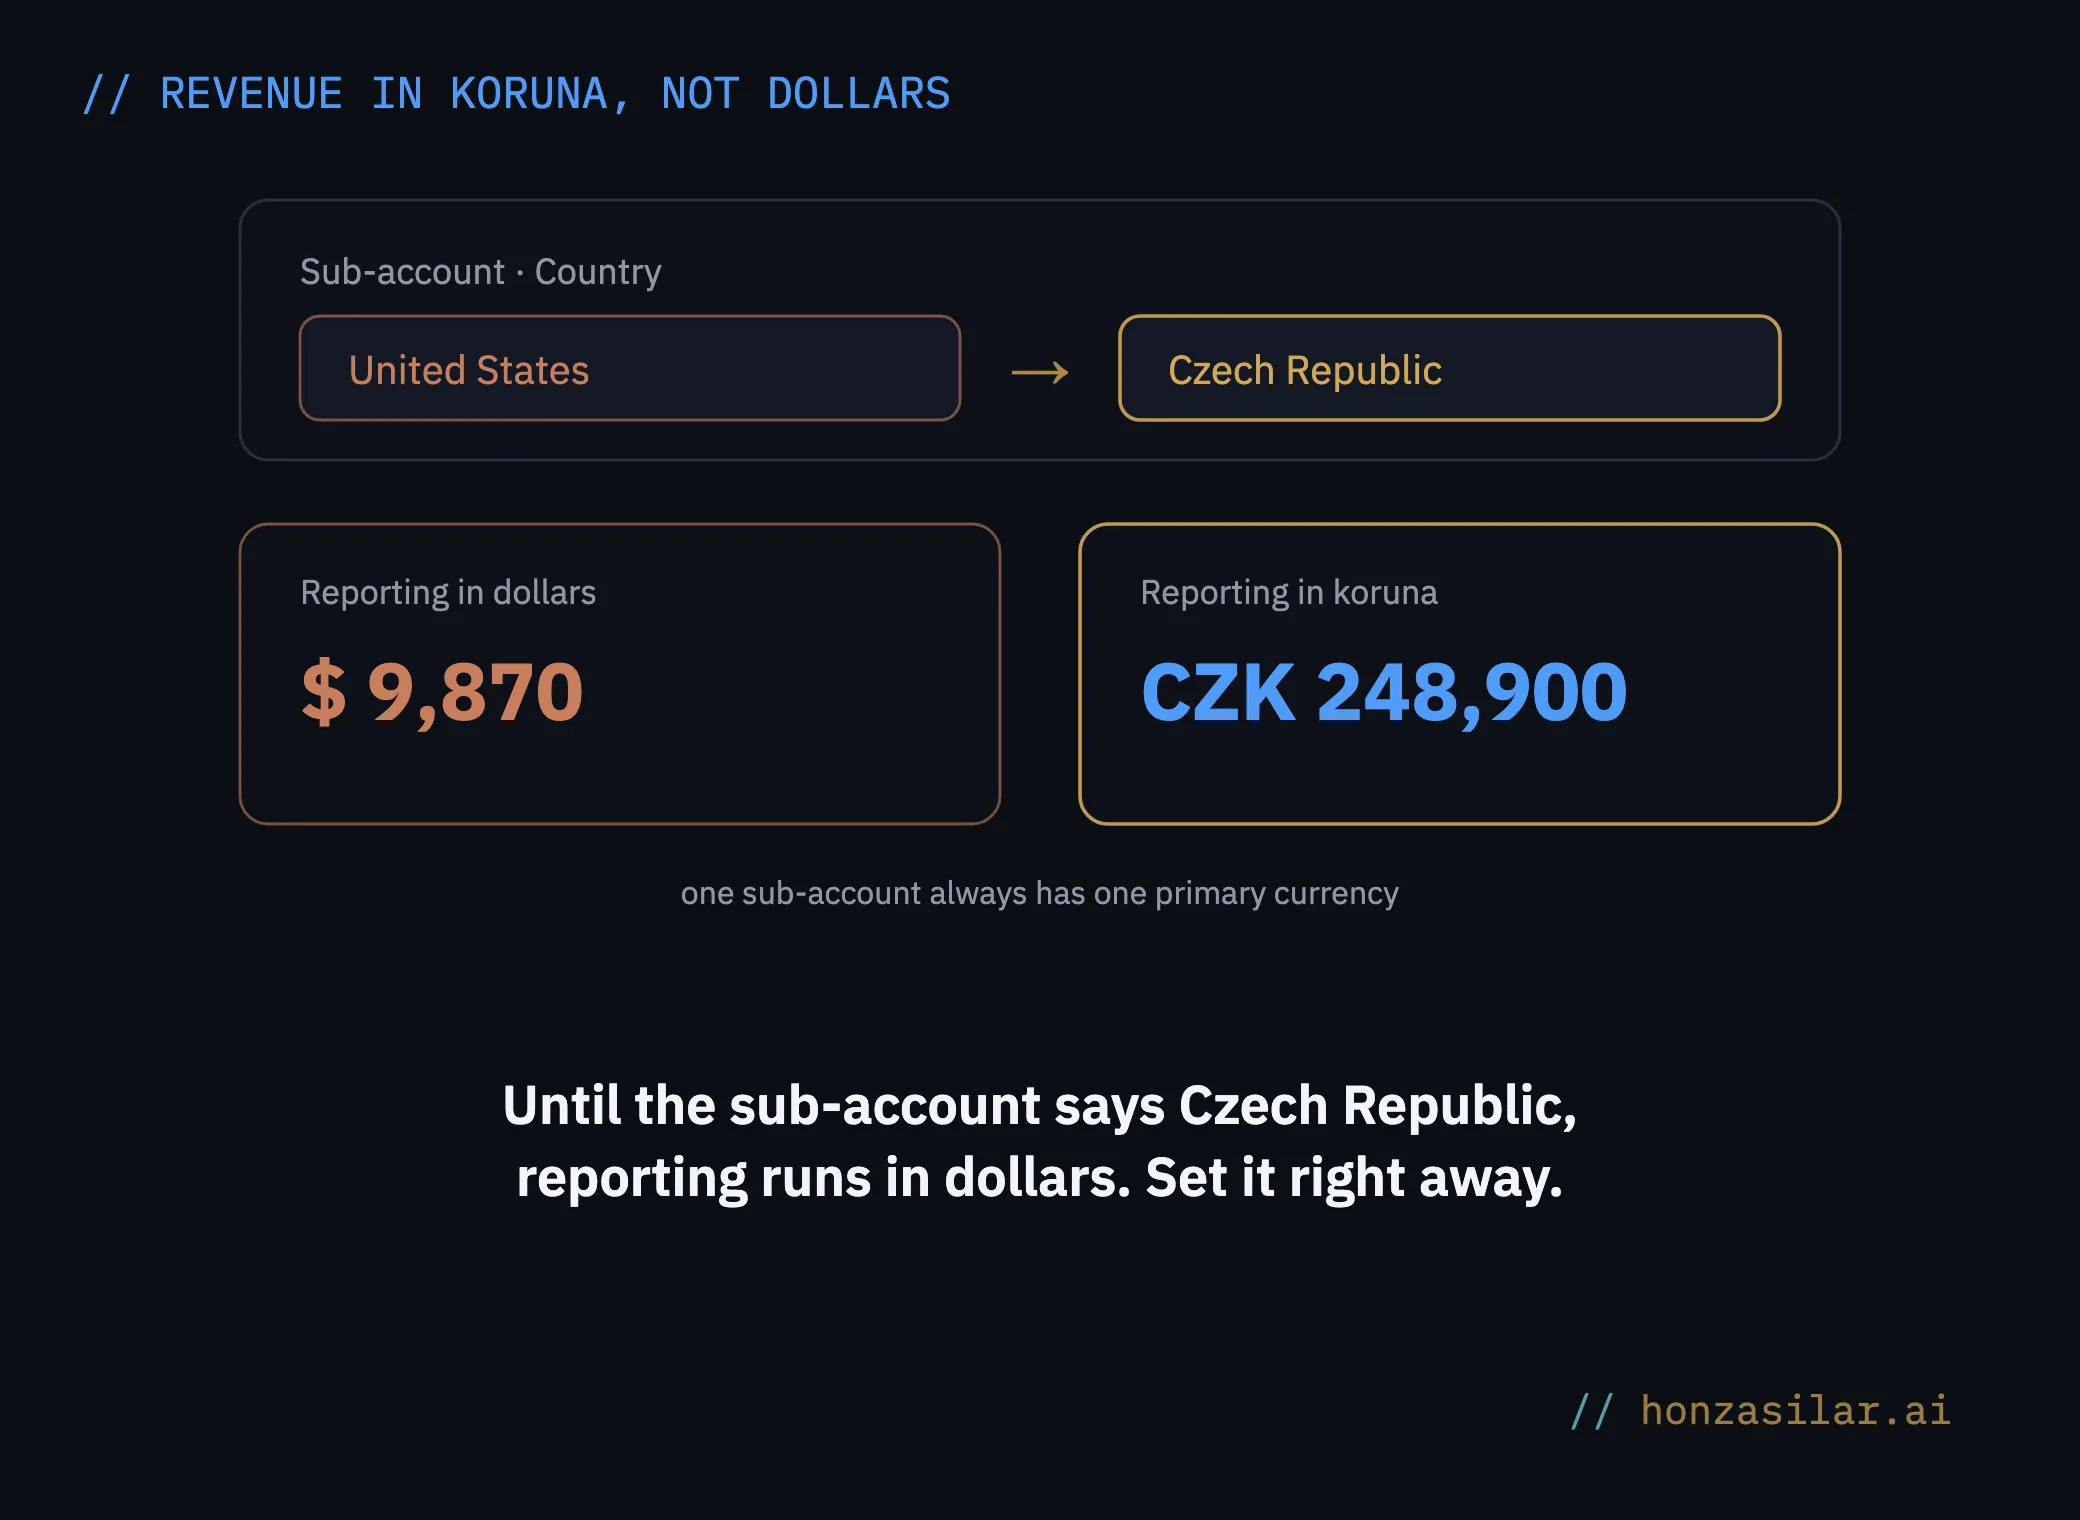
The reporting currency is controlled by the Country field on the sub-account. Until it says Czech Republic, the dashboard acts as if everything is in dollars; one sub-account always has one primary reporting currency, so set it right at the start.
Private dashboards don’t carry over in a snapshot. When you clone a setup from a template for a new client, the workflows and funnels come along, but you have to rebuild the dashboard. Factor that in when you plan onboarding.
And if you resell the platform as SaaS on the Agency Pro plan ($497/mo), you also get SaaS Analytics: an overview of recurring revenue broken down by new, expanded, and lost subscriptions, plus average revenue per customer and churn rate. You then measure your own business as rigorously as your clients’.
The whole system in a nutshell
- Data is created in one system: forms, emails, deals, and payments all on a single contact.
- You build the dashboard from widgets tailored to each specific client.
- From then on, the report updates itself; you don’t produce it.
- Your client checks their numbers anytime, not once a month in a PDF.
- Attribution with both views shows which channel really makes money.
Three beliefs that keep reporting from working
Go back to the scene from the beginning: four windows and a presentation at 10:30 at night. You’ll never bill your client for that time, because they pay for results, not for copying them from one tool to another. When the results show up on their own, the last evening of the month looks like any other.
Most of all, the question “so what has this actually earned us” stops arriving by email, because your client can see the answer anytime on their own. A client who sees their numbers doesn’t ask what they’re paying for. And clients who don’t ask don’t leave.